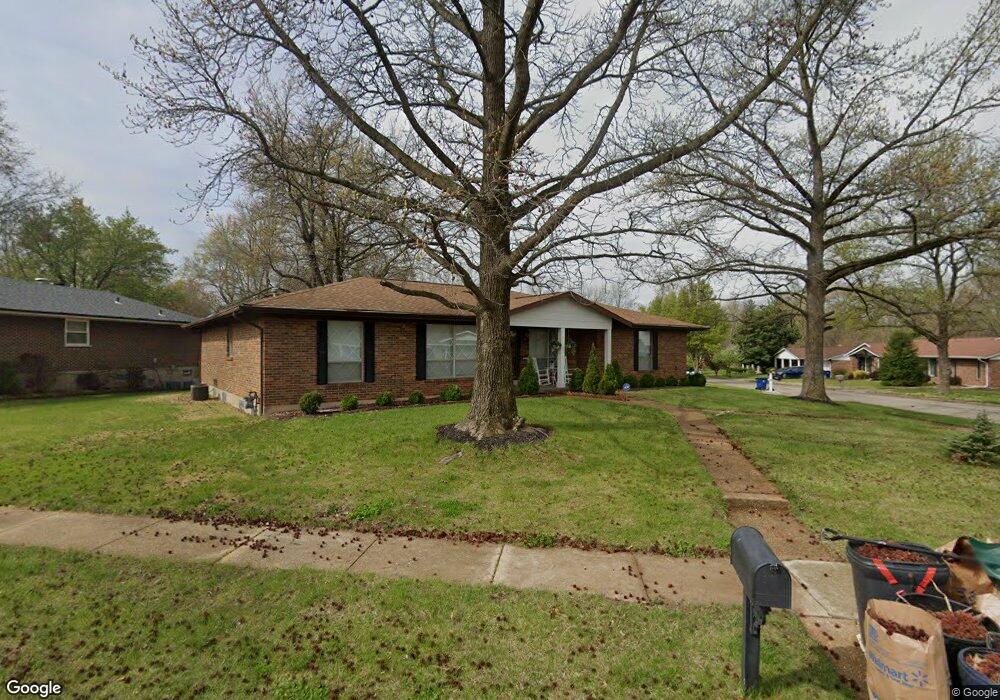
1 Flumet Ct Florissant, MO 63034
Estimated Value: $219,000 - $232,000
3
Beds
3
Baths
1,583
Sq Ft
$143/Sq Ft
Est. Value
About This Home
This home is located at 1 Flumet Ct, Florissant, MO 63034 and is currently estimated at $226,999, approximately $143 per square foot. 1 Flumet Ct is a home located in St. Louis County with nearby schools including Jana Elementary School, North Middle School, and Hazelwood Central High School.
Ownership History
Date
Name
Owned For
Owner Type
Purchase Details
Closed on
Apr 25, 2013
Sold by
Cue Gerald O and Cue Emily J
Bought by
Cue Gerald and Cue Emily
Current Estimated Value
Purchase Details
Closed on
Nov 9, 2011
Sold by
Cue Gerald O and Cue Emily J
Bought by
Irrevocable Living Trust Of Gerald & Emi
Purchase Details
Closed on
Apr 12, 2011
Sold by
Secretary Of Veterans Affairs
Bought by
Cue Gerald O and Cue Emily J
Purchase Details
Closed on
Mar 22, 2010
Sold by
Gully Wayne and Gully Bernetta M
Bought by
Secretary Of Veterans Affairs
Purchase Details
Closed on
Sep 19, 1997
Sold by
Associates Relocation Management Co Inc
Bought by
Gully Wayne and Gully Bernetta M
Home Financials for this Owner
Home Financials are based on the most recent Mortgage that was taken out on this home.
Original Mortgage
$101,850
Interest Rate
7.22%
Mortgage Type
VA
Purchase Details
Closed on
Jul 11, 1997
Sold by
John Heveroh
Bought by
Associates Relocation Management Co Inc
Create a Home Valuation Report for This Property
The Home Valuation Report is an in-depth analysis detailing your home's value as well as a comparison with similar homes in the area
Home Values in the Area
Average Home Value in this Area
Purchase History
| Date | Buyer | Sale Price | Title Company |
|---|---|---|---|
| Cue Gerald | -- | None Available | |
| Irrevocable Living Trust Of Gerald & Emi | -- | None Available | |
| Cue Gerald O | $78,750 | None Available | |
| Secretary Of Veterans Affairs | $114,569 | None Available | |
| Gully Wayne | -- | -- | |
| Associates Relocation Management Co Inc | -- | -- |
Source: Public Records
Mortgage History
| Date | Status | Borrower | Loan Amount |
|---|---|---|---|
| Previous Owner | Gully Wayne | $101,850 |
Source: Public Records
Tax History Compared to Growth
Tax History
| Year | Tax Paid | Tax Assessment Tax Assessment Total Assessment is a certain percentage of the fair market value that is determined by local assessors to be the total taxable value of land and additions on the property. | Land | Improvement |
|---|---|---|---|---|
| 2025 | $3,535 | $43,610 | $8,020 | $35,590 |
| 2024 | $3,535 | $38,890 | $3,210 | $35,680 |
| 2023 | $3,523 | $38,890 | $3,210 | $35,680 |
| 2022 | $3,277 | $32,170 | $6,250 | $25,920 |
| 2021 | $3,102 | $32,170 | $6,250 | $25,920 |
| 2020 | $2,680 | $25,860 | $4,640 | $21,220 |
| 2019 | $2,637 | $25,860 | $4,640 | $21,220 |
| 2018 | $2,599 | $23,560 | $3,570 | $19,990 |
| 2017 | $2,596 | $23,560 | $3,570 | $19,990 |
| 2016 | $2,441 | $21,780 | $4,640 | $17,140 |
| 2015 | $2,385 | $21,780 | $4,640 | $17,140 |
| 2014 | $2,326 | $21,140 | $4,120 | $17,020 |
Source: Public Records
Map
Nearby Homes
- 14420 Mondoubleau Ln
- 14234 Ashbury Meadows Dr
- 14519 Rosant Ct
- 14214 Ashbury Meadows Dr
- 3524 Candlebrook Ct
- 3614 Candlewyck Club Dr Unit E
- 3707 Candlewyck Club Dr Unit C
- 4328 Inlet Isle Dr
- 3898 Hirondelle Ln
- 14663 Rouvre Dr
- 4304 Inlet Isle Dr Unit 7
- 3230 Churchill Dr
- 3716 Rue de Renard
- 3929 Hirondelle Ln
- 3722 Candlewyck Club Dr Unit D
- 14333 River Oaks Ct
- 4308 Hollow Brook Ct
- 2756 Aberdeen Dr
- 2130 Barcelona Dr
- 15412 Forte de France Ln