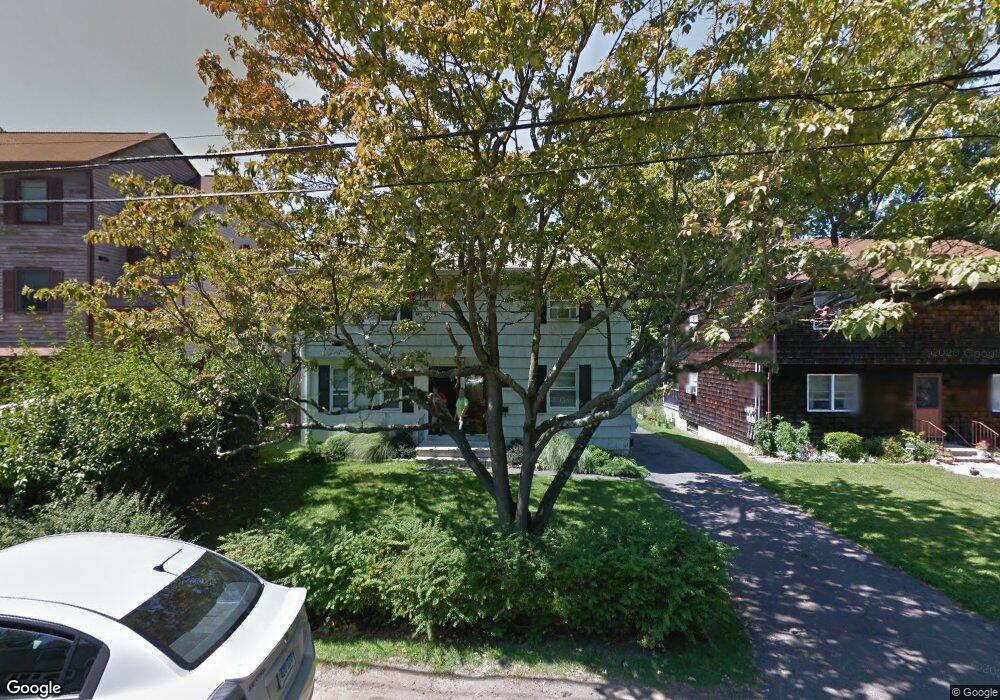
1 Fordham Dr Unit 2 Norwalk, CT 06855
East Norwalk NeighborhoodEstimated Value: $576,000 - $723,550
2
Beds
2
Baths
840
Sq Ft
$781/Sq Ft
Est. Value
About This Home
This home is located at 1 Fordham Dr Unit 2, Norwalk, CT 06855 and is currently estimated at $656,138, approximately $781 per square foot. 1 Fordham Dr Unit 2 is a home located in Fairfield County with nearby schools including Marvin Elementary School, Nathan Hale Middle School, and Norwalk High School.
Ownership History
Date
Name
Owned For
Owner Type
Purchase Details
Closed on
Aug 15, 2024
Sold by
Yang Ya Y
Bought by
Sigua Jennifer and Sigua Melissa M
Current Estimated Value
Home Financials for this Owner
Home Financials are based on the most recent Mortgage that was taken out on this home.
Original Mortgage
$531,250
Outstanding Balance
$525,330
Interest Rate
6.95%
Mortgage Type
Purchase Money Mortgage
Estimated Equity
$130,808
Purchase Details
Closed on
Apr 5, 2018
Sold by
Spagnola Timothy and Spagnola Sarah
Bought by
Yang Ya
Purchase Details
Closed on
Jan 6, 2003
Sold by
1 Fordham Dr Llc
Bought by
Lee Sarah and Spagnola Timothy
Home Financials for this Owner
Home Financials are based on the most recent Mortgage that was taken out on this home.
Original Mortgage
$300,000
Interest Rate
6.08%
Purchase Details
Closed on
Mar 31, 1998
Sold by
Abbott Deyoas C and Abbott Jean A
Bought by
Meils Frederick and Meils Mary A
Create a Home Valuation Report for This Property
The Home Valuation Report is an in-depth analysis detailing your home's value as well as a comparison with similar homes in the area
Home Values in the Area
Average Home Value in this Area
Purchase History
| Date | Buyer | Sale Price | Title Company |
|---|---|---|---|
| Sigua Jennifer | $625,000 | None Available | |
| Sigua Jennifer | $625,000 | None Available | |
| Yang Ya | $410,000 | -- | |
| Yang Ya | $410,000 | -- | |
| Lee Sarah | $375,000 | -- | |
| Lee Sarah | $375,000 | -- | |
| Meils Frederick | $220,000 | -- | |
| Meils Frederick | $220,000 | -- |
Source: Public Records
Mortgage History
| Date | Status | Borrower | Loan Amount |
|---|---|---|---|
| Open | Sigua Jennifer | $531,250 | |
| Closed | Sigua Jennifer | $531,250 | |
| Previous Owner | Meils Frederick | $300,000 | |
| Previous Owner | Meils Frederick | $55,172 |
Source: Public Records
Tax History
| Year | Tax Paid | Tax Assessment Tax Assessment Total Assessment is a certain percentage of the fair market value that is determined by local assessors to be the total taxable value of land and additions on the property. | Land | Improvement |
|---|---|---|---|---|
| 2025 | $9,301 | $389,160 | $166,580 | $222,580 |
| 2024 | $9,163 | $389,160 | $166,580 | $222,580 |
| 2023 | $7,320 | $291,780 | $129,210 | $162,570 |
| 2022 | $7,162 | $291,780 | $129,210 | $162,570 |
| 2021 | $6,994 | $291,780 | $129,210 | $162,570 |
| 2020 | $6,990 | $291,780 | $129,210 | $162,570 |
| 2019 | $6,803 | $291,780 | $129,210 | $162,570 |
| 2018 | $5,632 | $211,690 | $115,710 | $95,980 |
| 2017 | $5,437 | $211,690 | $115,710 | $95,980 |
| 2016 | $5,385 | $211,690 | $115,710 | $95,980 |
| 2015 | $5,371 | $211,690 | $115,710 | $95,980 |
| 2014 | $5,301 | $211,690 | $115,710 | $95,980 |
Source: Public Records
Map
Nearby Homes
- 1 Howard Ave Unit C4
- 18 Cloverly Cir
- 33 Myrtle St
- 23 Macintosh Rd
- 189 East Ave
- 16 Sunset Hill Ave
- 136 East Ave Unit 4C
- 144 East Ave Unit B404
- 142 East Ave Unit A305
- 281 East Ave
- 40 1st St
- 71A Osborne Ave Unit A4
- 80 Gregory Blvd
- 34 Shorehaven Rd
- 17 Pleasant St
- 100 Seaview Ave Unit 3I
- 100 Seaview Ave Unit 2J
- 11 Roland Ave
- 26 Cove Ave Unit 3B
- 4 van Zant St Unit A2
- 1 Fordham Dr
- 1 Fordham Dr Unit 1
- 1 Fordham Dr
- 3 Fordham Dr
- 40 Howard Ave Unit B2
- 40 Howard Ave Unit B1
- 40 Howard Ave Unit A2
- 40 Howard Ave Unit A1
- 40 Howard Ave Unit A2
- 42 Howard Ave
- 5 Fordham Dr
- 4 Fordham Dr
- 44 Howard Ave
- 32 1/2 Howard Ave
- 32 Howard Ave
- 7 Fordham Dr
- 46 Howard Ave
- 8 Fordham Dr
- 30 Howard Ave
- 48 Howard Ave
Your Personal Tour Guide
Ask me questions while you tour the home.