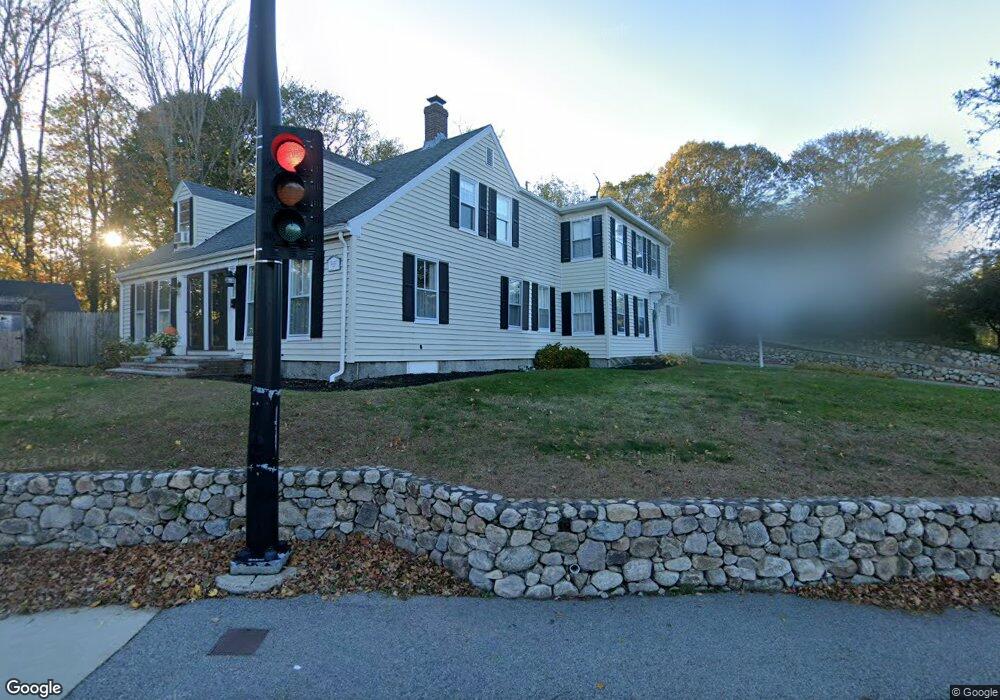
1 Fort Hill St Unit 2 Hingham, MA 02043
Estimated Value: $513,000 - $558,000
2
Beds
2
Baths
1,212
Sq Ft
$441/Sq Ft
Est. Value
About This Home
This home is located at 1 Fort Hill St Unit 2, Hingham, MA 02043 and is currently estimated at $534,510, approximately $441 per square foot. 1 Fort Hill St Unit 2 is a home located in Plymouth County with nearby schools including Plymouth River Elementary School, Hingham Middle School, and Hingham High School.
Ownership History
Date
Name
Owned For
Owner Type
Purchase Details
Closed on
Sep 24, 2025
Sold by
Burke-Roth Mary
Bought by
Zeiberg Samuel J and Zeiberg Kara E
Current Estimated Value
Home Financials for this Owner
Home Financials are based on the most recent Mortgage that was taken out on this home.
Original Mortgage
$436,000
Outstanding Balance
$434,829
Interest Rate
6.58%
Mortgage Type
New Conventional
Estimated Equity
$99,681
Purchase Details
Closed on
Sep 4, 2003
Sold by
Burke Joan M
Bought by
Burke-Roth Mary
Purchase Details
Closed on
Aug 4, 1993
Sold by
Beise F Andrew F and Beise Judith D
Bought by
Burke Francis D
Home Financials for this Owner
Home Financials are based on the most recent Mortgage that was taken out on this home.
Original Mortgage
$78,800
Interest Rate
7.29%
Mortgage Type
Purchase Money Mortgage
Create a Home Valuation Report for This Property
The Home Valuation Report is an in-depth analysis detailing your home's value as well as a comparison with similar homes in the area
Purchase History
| Date | Buyer | Sale Price | Title Company |
|---|---|---|---|
| Zeiberg Samuel J | $545,000 | -- | |
| Burke-Roth Mary | -- | -- | |
| Burke Francis D | $98,500 | -- |
Source: Public Records
Mortgage History
| Date | Status | Borrower | Loan Amount |
|---|---|---|---|
| Open | Zeiberg Samuel J | $436,000 | |
| Previous Owner | Burke Francis D | $78,800 |
Source: Public Records
Tax History
| Year | Tax Paid | Tax Assessment Tax Assessment Total Assessment is a certain percentage of the fair market value that is determined by local assessors to be the total taxable value of land and additions on the property. | Land | Improvement |
|---|---|---|---|---|
| 2025 | $3,666 | $342,900 | $0 | $342,900 |
| 2024 | $3,720 | $342,900 | $0 | $342,900 |
| 2023 | $3,164 | $316,400 | $0 | $316,400 |
| 2022 | $3,467 | $299,900 | $0 | $299,900 |
| 2021 | $3,539 | $299,900 | $0 | $299,900 |
| 2020 | $3,458 | $299,900 | $0 | $299,900 |
| 2019 | $3,542 | $299,900 | $0 | $299,900 |
| 2018 | $3,353 | $284,900 | $0 | $284,900 |
| 2017 | $3,167 | $258,500 | $0 | $258,500 |
| 2016 | $3,104 | $248,500 | $0 | $248,500 |
| 2015 | $3,072 | $245,200 | $0 | $245,200 |
Source: Public Records
Map
Nearby Homes
- 6 Adams Ct
- 225 South St Unit 1
- 21 Hersey St
- 1 Squirrel Hill Ln
- 7 Lewis Ct
- 19 Lantern Ln
- 43 Park View Dr
- 156 Fort Hill St
- 6 Brewer Way
- 1206 Tuckers Ln Unit 1206
- 34 Otis Hill Rd
- 151 Stayner Dr Unit 151
- 132 Hms Stayner Dr Unit 132
- 428 Main St
- 6 Leavitt St
- 168 Stayner Dr Unit 168
- 12 Daley Rd
- 23 Shipyard Dr Unit 206
- 14 Spring St
- 109 Merryknoll Rd
Your Personal Tour Guide
Ask me questions while you tour the home.