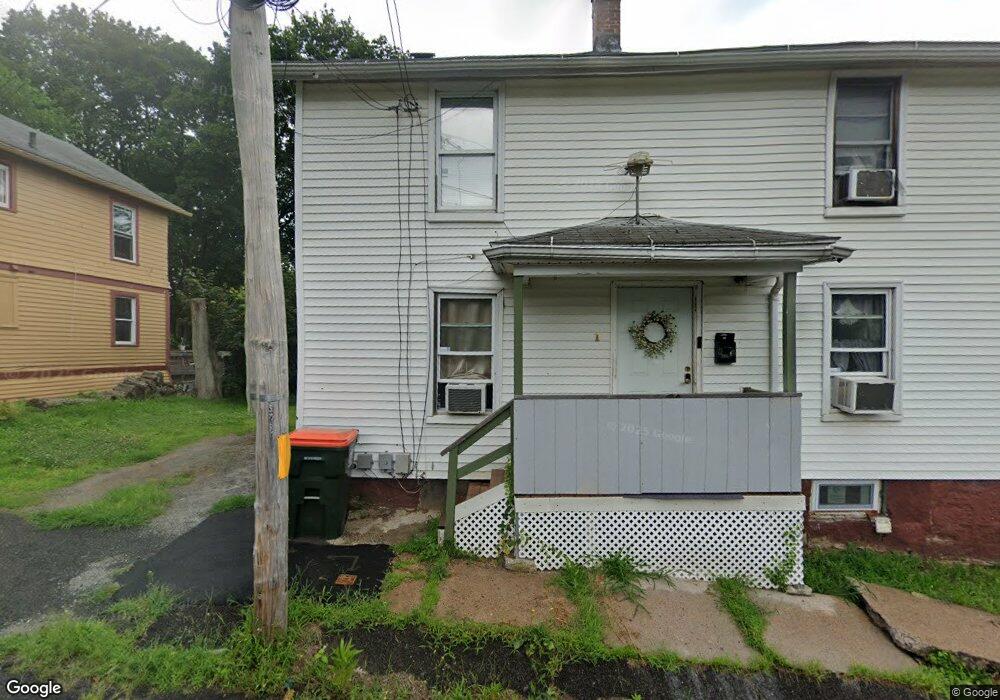
1 Foster Ct Meriden, CT 06451
Estimated Value: $178,000 - $248,458
3
Beds
2
Baths
1,232
Sq Ft
$179/Sq Ft
Est. Value
About This Home
This home is located at 1 Foster Ct, Meriden, CT 06451 and is currently estimated at $220,486, approximately $178 per square foot. 1 Foster Ct is a home located in New Haven County with nearby schools including John Barry School, Lincoln Middle School, and Orville H. Platt High School.
Ownership History
Date
Name
Owned For
Owner Type
Purchase Details
Closed on
Oct 24, 2023
Sold by
Rivera Fermin
Bought by
Rivera Evelyn and Espino Jesus
Current Estimated Value
Purchase Details
Closed on
Oct 19, 2023
Sold by
Poole Mark L
Bought by
Rivera Fermin
Purchase Details
Closed on
Aug 27, 2001
Sold by
Furrer Trevor
Bought by
Poole Mark L
Home Financials for this Owner
Home Financials are based on the most recent Mortgage that was taken out on this home.
Original Mortgage
$64,000
Interest Rate
7.21%
Mortgage Type
Purchase Money Mortgage
Purchase Details
Closed on
May 22, 2001
Sold by
Parian David and Parian Karen
Bought by
Furrer Trevor
Purchase Details
Closed on
Oct 3, 1996
Sold by
Parian David and Parian Karen
Bought by
Roman Rene and Cole Heather
Home Financials for this Owner
Home Financials are based on the most recent Mortgage that was taken out on this home.
Original Mortgage
$94,337
Interest Rate
8.5%
Mortgage Type
Purchase Money Mortgage
Create a Home Valuation Report for This Property
The Home Valuation Report is an in-depth analysis detailing your home's value as well as a comparison with similar homes in the area
Home Values in the Area
Average Home Value in this Area
Purchase History
| Date | Buyer | Sale Price | Title Company |
|---|---|---|---|
| Rivera Evelyn | $130,000 | None Available | |
| Rivera Fermin | $75,000 | None Available | |
| Poole Mark L | $80,000 | -- | |
| Furrer Trevor | $33,000 | -- | |
| Roman Rene | $94,740 | -- |
Source: Public Records
Mortgage History
| Date | Status | Borrower | Loan Amount |
|---|---|---|---|
| Previous Owner | Roman Rene | $78,000 | |
| Previous Owner | Roman Rene | $64,000 | |
| Previous Owner | Roman Rene | $21,420 | |
| Previous Owner | Roman Rene | $94,337 |
Source: Public Records
Tax History Compared to Growth
Tax History
| Year | Tax Paid | Tax Assessment Tax Assessment Total Assessment is a certain percentage of the fair market value that is determined by local assessors to be the total taxable value of land and additions on the property. | Land | Improvement |
|---|---|---|---|---|
| 2025 | $3,267 | $86,170 | $21,700 | $64,470 |
| 2024 | $3,318 | $86,170 | $21,700 | $64,470 |
| 2023 | $3,199 | $86,170 | $21,700 | $64,470 |
| 2022 | $3,018 | $86,170 | $21,700 | $64,470 |
| 2021 | $2,636 | $60,550 | $18,270 | $42,280 |
| 2020 | $2,628 | $60,550 | $18,270 | $42,280 |
| 2019 | $2,606 | $60,550 | $18,270 | $42,280 |
| 2018 | $2,616 | $60,550 | $18,270 | $42,280 |
| 2017 | $2,547 | $60,550 | $18,270 | $42,280 |
| 2016 | $2,917 | $75,390 | $20,510 | $54,880 |
| 2015 | $2,917 | $75,250 | $20,370 | $54,880 |
| 2014 | $2,847 | $75,250 | $20,370 | $54,880 |
Source: Public Records
Map
Nearby Homes