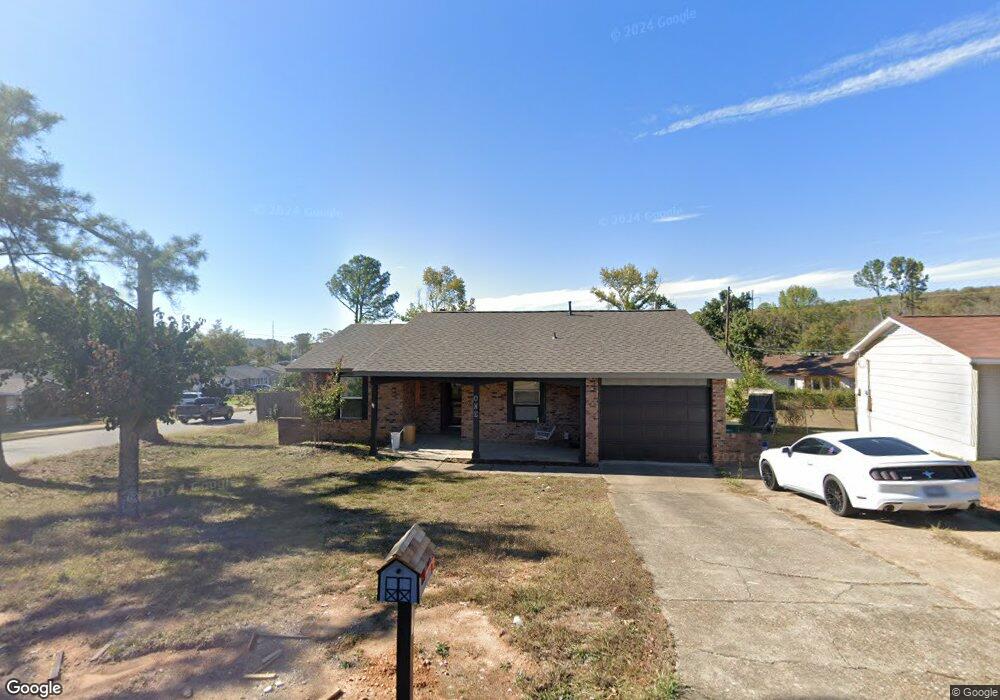
1 Foxboro Ct North Little Rock, AR 72118
Amboy NeighborhoodEstimated Value: $132,000 - $148,000
3
Beds
2
Baths
1,294
Sq Ft
$107/Sq Ft
Est. Value
About This Home
This home is located at 1 Foxboro Ct, North Little Rock, AR 72118 and is currently estimated at $138,037, approximately $106 per square foot. 1 Foxboro Ct is a home located in Pulaski County with nearby schools including Amboy Elementary School, North Little Rock Middle School 6th Grade Campus, and North Little Rock High School.
Ownership History
Date
Name
Owned For
Owner Type
Purchase Details
Closed on
Jul 8, 2016
Sold by
Sanders Cindy
Bought by
Sanders Richard and Sanders Monica
Current Estimated Value
Home Financials for this Owner
Home Financials are based on the most recent Mortgage that was taken out on this home.
Original Mortgage
$86,503
Outstanding Balance
$69,048
Interest Rate
3.66%
Mortgage Type
FHA
Estimated Equity
$68,989
Purchase Details
Closed on
Jan 12, 2004
Sold by
Sanders Norman
Bought by
Sanders Cindy
Purchase Details
Closed on
Apr 14, 2000
Sold by
Gambrell Bryce Spencer and Gambrell Christine A
Bought by
Sanders Norman K and Sanders Cindy A
Home Financials for this Owner
Home Financials are based on the most recent Mortgage that was taken out on this home.
Original Mortgage
$58,850
Interest Rate
8.24%
Mortgage Type
VA
Purchase Details
Closed on
Dec 30, 1997
Sold by
Sacrey James A and Sacrey Patricia J
Bought by
Gambrell Bryce Spencer
Create a Home Valuation Report for This Property
The Home Valuation Report is an in-depth analysis detailing your home's value as well as a comparison with similar homes in the area
Home Values in the Area
Average Home Value in this Area
Purchase History
| Date | Buyer | Sale Price | Title Company |
|---|---|---|---|
| Sanders Richard | $88,100 | Professional Land Title Co O | |
| Sanders Cindy | -- | -- | |
| Sanders Norman K | $63,000 | American Abstract Title Co | |
| Gambrell Bryce Spencer | $57,000 | American Abstract & Title Co | |
| Gambrell Bryce Spencer | $57,000 | American Abstract & Title Co |
Source: Public Records
Mortgage History
| Date | Status | Borrower | Loan Amount |
|---|---|---|---|
| Open | Sanders Richard | $86,503 | |
| Previous Owner | Sanders Norman K | $58,850 |
Source: Public Records
Tax History Compared to Growth
Tax History
| Year | Tax Paid | Tax Assessment Tax Assessment Total Assessment is a certain percentage of the fair market value that is determined by local assessors to be the total taxable value of land and additions on the property. | Land | Improvement |
|---|---|---|---|---|
| 2025 | $1,349 | $22,880 | $3,000 | $19,880 |
| 2024 | $200 | $22,880 | $3,000 | $19,880 |
| 2023 | $200 | $3,000 | $3,000 | $0 |
| 2022 | $1,181 | $22,880 | $3,000 | $19,880 |
| 2021 | $1,125 | $16,840 | $3,500 | $13,340 |
| 2020 | $750 | $16,840 | $3,500 | $13,340 |
| 2019 | $750 | $16,840 | $3,500 | $13,340 |
| 2018 | $775 | $16,840 | $3,500 | $13,340 |
| 2017 | $775 | $16,840 | $3,500 | $13,340 |
| 2016 | $1,102 | $16,500 | $4,000 | $12,500 |
| 2015 | $1,102 | $16,500 | $4,000 | $12,500 |
| 2014 | $1,102 | $16,500 | $4,000 | $12,500 |
Source: Public Records
Map
Nearby Homes
- Lot 87 Foxboro Dr
- Lot 86 Foxboro Dr
- Lot 85 Foxboro Dr
- Lot 84 Foxboro Dr
- Lot 83 Foxboro Dr
- Lot 82 Foxboro Dr
- Lot 96 Foxboro Dr
- Lot 95 Foxboro Dr
- Lot 90 Foxboro Dr
- Lot 91 Foxboro Dr
- Lot 89 Foxboro Dr
- Lot 88 Foxboro Dr
- 1108 Nicole Dr
- 5630 Foxboro Dr
- 900 Donovan Briley Blvd
- 901 W 58th St
- 5612 Division St
- 5502 Francis St
- 409 Harper Ln
- 5709 Shamrock Dr