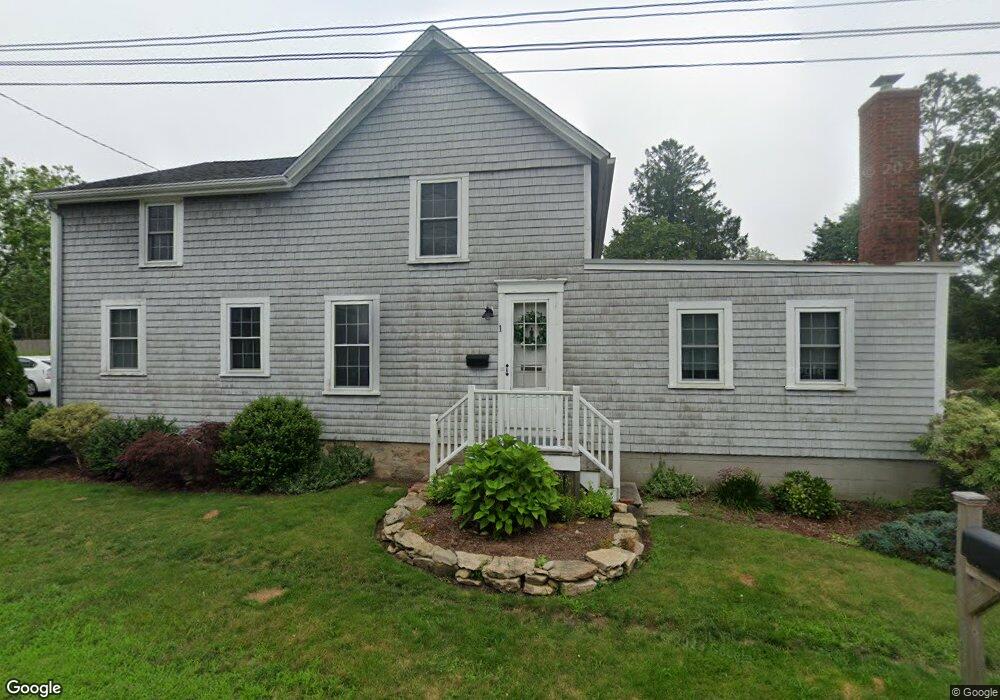
1 Franklin St South Dartmouth, MA 02748
Dartmouth Community Park NeighborhoodEstimated Value: $701,000 - $894,000
5
Beds
2
Baths
2,231
Sq Ft
$359/Sq Ft
Est. Value
About This Home
This home is located at 1 Franklin St, South Dartmouth, MA 02748 and is currently estimated at $800,580, approximately $358 per square foot. 1 Franklin St is a home located in Bristol County with nearby schools including Dartmouth High School and St. Teresa of Calcutta School.
Ownership History
Date
Name
Owned For
Owner Type
Purchase Details
Closed on
Apr 10, 2007
Sold by
Wood Barbara B and Wood John M
Bought by
Sylvia Hillary A and Sylvia Jonathan W
Current Estimated Value
Home Financials for this Owner
Home Financials are based on the most recent Mortgage that was taken out on this home.
Original Mortgage
$280,000
Outstanding Balance
$170,225
Interest Rate
6.25%
Mortgage Type
Purchase Money Mortgage
Estimated Equity
$630,355
Purchase Details
Closed on
Aug 15, 2006
Sold by
Johnson Emily W and Wood Jonathan M
Bought by
Wood Barbara B and Wood John M
Home Financials for this Owner
Home Financials are based on the most recent Mortgage that was taken out on this home.
Original Mortgage
$375,000
Interest Rate
6.79%
Purchase Details
Closed on
Mar 18, 2005
Sold by
Wood Barbara B and Wood John M
Bought by
Wood Barbara B and Johnson Emily W
Create a Home Valuation Report for This Property
The Home Valuation Report is an in-depth analysis detailing your home's value as well as a comparison with similar homes in the area
Home Values in the Area
Average Home Value in this Area
Purchase History
| Date | Buyer | Sale Price | Title Company |
|---|---|---|---|
| Sylvia Hillary A | $430,000 | -- | |
| Wood Barbara B | -- | -- | |
| Wood Barbara B | -- | -- |
Source: Public Records
Mortgage History
| Date | Status | Borrower | Loan Amount |
|---|---|---|---|
| Open | Wood Barbara B | $280,000 | |
| Previous Owner | Wood Barbara B | $375,000 | |
| Previous Owner | Wood Barbara B | $53,446 |
Source: Public Records
Tax History Compared to Growth
Tax History
| Year | Tax Paid | Tax Assessment Tax Assessment Total Assessment is a certain percentage of the fair market value that is determined by local assessors to be the total taxable value of land and additions on the property. | Land | Improvement |
|---|---|---|---|---|
| 2025 | $5,230 | $607,400 | $306,300 | $301,100 |
| 2024 | $5,075 | $584,000 | $292,900 | $291,100 |
| 2023 | $4,938 | $538,500 | $266,300 | $272,200 |
| 2022 | $4,668 | $471,500 | $250,300 | $221,200 |
| 2021 | $4,050 | $415,400 | $230,100 | $185,300 |
| 2020 | $4,362 | $420,200 | $235,200 | $185,000 |
| 2019 | $4,285 | $412,000 | $232,700 | $179,300 |
| 2018 | $3,883 | $392,700 | $226,200 | $166,500 |
| 2017 | $3,901 | $389,300 | $225,600 | $163,700 |
| 2016 | $3,795 | $373,500 | $211,000 | $162,500 |
| 2015 | $3,833 | $378,000 | $213,100 | $164,900 |
| 2014 | $3,498 | $342,600 | $180,800 | $161,800 |
Source: Public Records
Map
Nearby Homes
- 40 School St
- 0 Stoneledge Rd
- 23 High St
- 00 Prospect St
- 2 Spinnaker Ln
- 48 Wilson St
- 179 Rockland St
- 76 Shipyard Ln
- 21 Avis St
- 59 Hidden Bay Dr
- 212 Rockland St
- 0 East Ave Unit 73382206
- 15 Puritan St
- 18 Saint John St
- 1 Walter St
- 75 Country Way Unit 75
- 738 Smith Neck Rd
- 3 Mishawum Dr
- 5 Samosett Dr
- 6 Jacob Dr