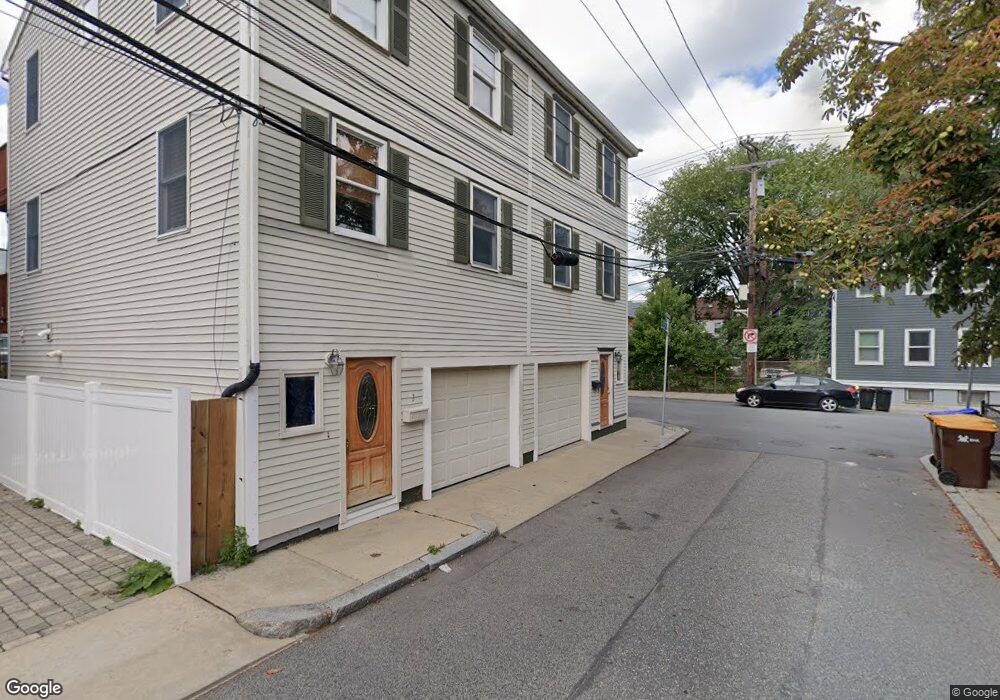
1 Frederick St Unit 2 Boston, MA 02127
South Boston NeighborhoodEstimated Value: $1,024,125 - $1,301,000
1
Bed
1
Bath
900
Sq Ft
$1,279/Sq Ft
Est. Value
About This Home
This home is located at 1 Frederick St Unit 2, Boston, MA 02127 and is currently estimated at $1,150,781, approximately $1,278 per square foot. 1 Frederick St Unit 2 is a home located in Suffolk County with nearby schools including Up Academy Charter School Of Boston, St Peter Academy, and Gate of Heaven Elementary School.
Ownership History
Date
Name
Owned For
Owner Type
Purchase Details
Closed on
Oct 17, 2022
Sold by
Wiederer Edward A and Wiederer Ginger R
Bought by
Deshaney Ginger R
Current Estimated Value
Home Financials for this Owner
Home Financials are based on the most recent Mortgage that was taken out on this home.
Original Mortgage
$400,000
Outstanding Balance
$380,489
Interest Rate
4.9%
Mortgage Type
Adjustable Rate Mortgage/ARM
Estimated Equity
$770,292
Purchase Details
Closed on
Apr 25, 2000
Sold by
Frederick St Rt
Bought by
Weiderer Edward A and Deshaney-Wied Ginger R
Purchase Details
Closed on
Apr 15, 1998
Sold by
Glen Down Rt and Gleason Ronald
Bought by
Frederick St Rt 1-3 and Turner Carl
Create a Home Valuation Report for This Property
The Home Valuation Report is an in-depth analysis detailing your home's value as well as a comparison with similar homes in the area
Home Values in the Area
Average Home Value in this Area
Purchase History
| Date | Buyer | Sale Price | Title Company |
|---|---|---|---|
| Deshaney Ginger R | -- | None Available | |
| Deshaney Ginger R | -- | None Available | |
| Weiderer Edward A | $265,000 | -- | |
| Frederick St Rt 1-3 | $23,000 | -- | |
| Weiderer Edward A | $265,000 | -- |
Source: Public Records
Mortgage History
| Date | Status | Borrower | Loan Amount |
|---|---|---|---|
| Open | Deshaney Ginger R | $400,000 | |
| Closed | Deshaney Ginger R | $400,000 | |
| Previous Owner | Frederick St Rt 1-3 | $114,443 | |
| Previous Owner | Frederick St Rt 1-3 | $114,000 |
Source: Public Records
Tax History Compared to Growth
Tax History
| Year | Tax Paid | Tax Assessment Tax Assessment Total Assessment is a certain percentage of the fair market value that is determined by local assessors to be the total taxable value of land and additions on the property. | Land | Improvement |
|---|---|---|---|---|
| 2025 | $11,301 | $975,900 | $264,200 | $711,700 |
| 2024 | $10,269 | $942,100 | $224,900 | $717,200 |
| 2023 | $9,370 | $872,400 | $208,300 | $664,100 |
| 2022 | $8,628 | $793,000 | $189,300 | $603,700 |
| 2021 | $7,835 | $734,300 | $175,300 | $559,000 |
| 2020 | $7,007 | $663,500 | $175,200 | $488,300 |
| 2019 | $6,662 | $632,100 | $131,600 | $500,500 |
| 2018 | $6,311 | $602,200 | $131,600 | $470,600 |
| 2017 | $6,070 | $573,200 | $131,600 | $441,600 |
| 2016 | $5,484 | $498,500 | $131,600 | $366,900 |
| 2015 | $5,583 | $461,000 | $113,400 | $347,600 |
| 2014 | $5,075 | $403,400 | $113,400 | $290,000 |
Source: Public Records
Map
Nearby Homes
- 163 W 8th St
- 224 W 9th St Unit 1
- 26 F St Unit 1
- 26 F St
- 136 W 8th St Unit 4
- 136 W 8th St Unit 1
- 256 Dorchester St Unit 305
- 256 Dorchester St Unit 303
- 256 Dorchester St Unit 504
- 236-256 Dorchester St Unit 201
- 220 Dorchester St
- 80 Baxter St
- 64 Baxter St Unit 1
- 153-157 W Seventh St
- 212 W 6th St Unit 212
- 210 W 6th St Unit 210
- 92 W 8th St Unit 3
- 92 W 8th St Unit 4
- 267 Old Colony Ave Unit 404
- 267 Old Colony Ave Unit 402
- 1 Frederick St
- 3 Frederick St
- 3 Frederick St Unit A
- 169 W 9th St
- 169 W 9th St
- 169 W 9th St Unit 1
- 2 Cottage St
- 2 Cottage St Unit 2-4 1
- 2 Cottage St Unit 1
- 2 Cottage St
- 2 Cottage St Unit 2-4 3
- 2 Cottage St Unit 2-4 2 copy
- 2 Cottage St Unit 3b
- 2 Cottage St Unit 3a
- 2 Cottage St Unit 2b
- 2 Cottage St Unit 2a
- 2 Cottage St
- 2 Cottage St Unit 1
- 2 Cottage St Unit 3
- 2 Cottage St Unit 2