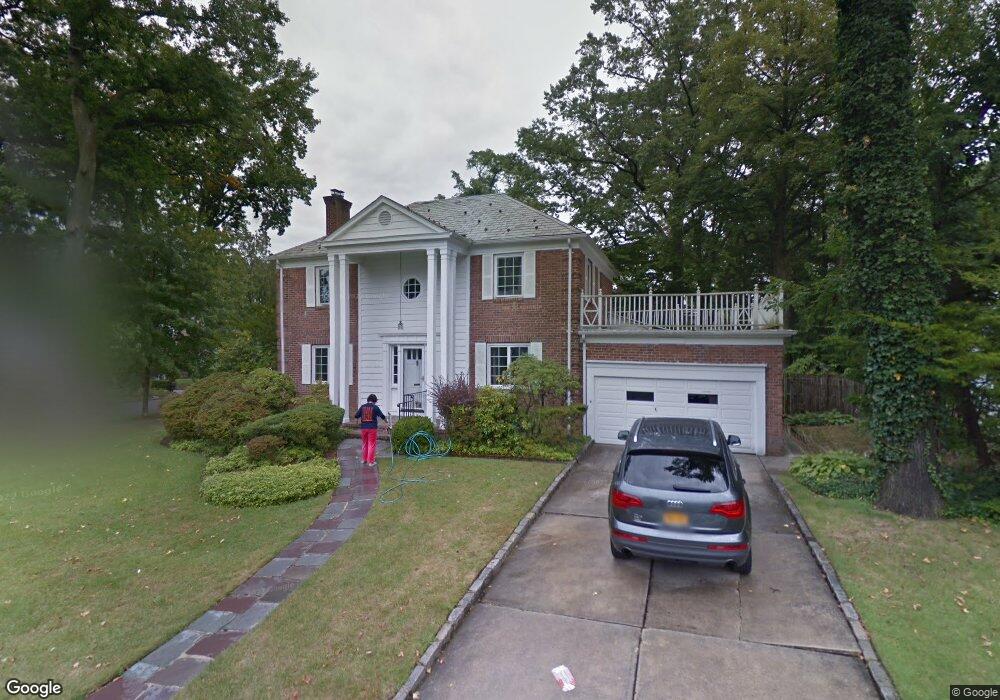
1 Garden St Great Neck, NY 11021
Estimated Value: $1,575,382 - $1,622,000
4
Beds
3
Baths
2,250
Sq Ft
$711/Sq Ft
Est. Value
About This Home
This home is located at 1 Garden St, Great Neck, NY 11021 and is currently estimated at $1,598,691, approximately $710 per square foot. 1 Garden St is a home located in Nassau County with nearby schools including Saddle Rock School, Great Neck South Middle School, and Richard S. Sherman - Great Neck North Middle School.
Ownership History
Date
Name
Owned For
Owner Type
Purchase Details
Closed on
Sep 8, 2017
Sold by
Jiao Chengyue and Xiao Wei
Bought by
Cai Lisi and Tam Gordan Manho
Current Estimated Value
Home Financials for this Owner
Home Financials are based on the most recent Mortgage that was taken out on this home.
Original Mortgage
$733,000
Outstanding Balance
$594,395
Interest Rate
2.87%
Mortgage Type
Adjustable Rate Mortgage/ARM
Estimated Equity
$1,004,296
Purchase Details
Closed on
Jan 4, 2011
Sold by
Goodrich Ruth and Kirsch Karen
Bought by
Jiao Chengyue and Xiao Wei
Home Financials for this Owner
Home Financials are based on the most recent Mortgage that was taken out on this home.
Original Mortgage
$550,000
Interest Rate
4.62%
Mortgage Type
Purchase Money Mortgage
Purchase Details
Closed on
Apr 16, 1997
Create a Home Valuation Report for This Property
The Home Valuation Report is an in-depth analysis detailing your home's value as well as a comparison with similar homes in the area
Home Values in the Area
Average Home Value in this Area
Purchase History
| Date | Buyer | Sale Price | Title Company |
|---|---|---|---|
| Cai Lisi | $1,233,000 | The Judicial Title Insurance | |
| Jiao Chengyue | $876,000 | -- | |
| -- | -- | -- |
Source: Public Records
Mortgage History
| Date | Status | Borrower | Loan Amount |
|---|---|---|---|
| Open | Cai Lisi | $733,000 | |
| Previous Owner | Jiao Chengyue | $550,000 |
Source: Public Records
Tax History Compared to Growth
Tax History
| Year | Tax Paid | Tax Assessment Tax Assessment Total Assessment is a certain percentage of the fair market value that is determined by local assessors to be the total taxable value of land and additions on the property. | Land | Improvement |
|---|---|---|---|---|
| 2025 | $18,884 | $970 | $419 | $551 |
| 2024 | $5,628 | $1,009 | $436 | $573 |
| 2023 | $18,271 | $1,134 | $490 | $644 |
| 2022 | $18,271 | $1,285 | $559 | $726 |
| 2021 | $20,393 | $1,213 | $524 | $689 |
| 2020 | $17,855 | $1,485 | $1,271 | $214 |
| 2019 | $16,092 | $1,485 | $1,192 | $293 |
| 2018 | $16,092 | $1,584 | $0 | $0 |
| 2017 | $10,104 | $1,683 | $1,132 | $551 |
| 2016 | $15,549 | $1,890 | $1,271 | $619 |
| 2015 | $5,821 | $1,890 | $1,271 | $619 |
| 2014 | $5,821 | $1,890 | $1,271 | $619 |
| 2013 | $5,555 | $1,890 | $1,271 | $619 |
Source: Public Records
Map
Nearby Homes
- 12 Longview Place
- 125 Colonial Rd
- 21 Chapel Place Unit 3M
- 25 Chapel Place Unit 1B
- 25 Chapel Place Unit 2D
- 25 Chapel Place Unit 3N
- 90 Schenck Ave Unit 2L
- 15 Canterbury Rd Unit D-18
- 15 Canterbury Rd Unit C23
- 15 Canterbury Rd Unit C-13
- 15 Canterbury Rd Unit D13
- 15 Canterbury Rd Unit D6
- 15 Canterbury Rd Unit C10
- 21 Canterbury Rd Unit 17
- 21 Canterbury Rd Unit 6
- 21 Canterbury Rd
- 8 Welwyn Rd Unit 3F
- 40 Stoner Ave Unit 2F
- 40 Stoner Ave Unit 1I
- 25 Canterbury Rd Unit 3F
- 136 Shoreward Dr
- 3 Garden St
- 2 Garden St
- 4 Garden St
- 5 Garden St
- 4 Longview Place
- 2 Longview Place
- 6 Garden St
- 133 Shoreward Dr
- 6 Longview Place
- 131 Shoreward Dr
- 7 Garden St
- 134 Shoreward Dr
- 8 Garden St
- 129 Shoreward Dr
- 8 Longview Place
- 130 Shoreward Dr
- 3 Wyngate Place
- 135 Shoreward Dr
- 5 Wyngate Place