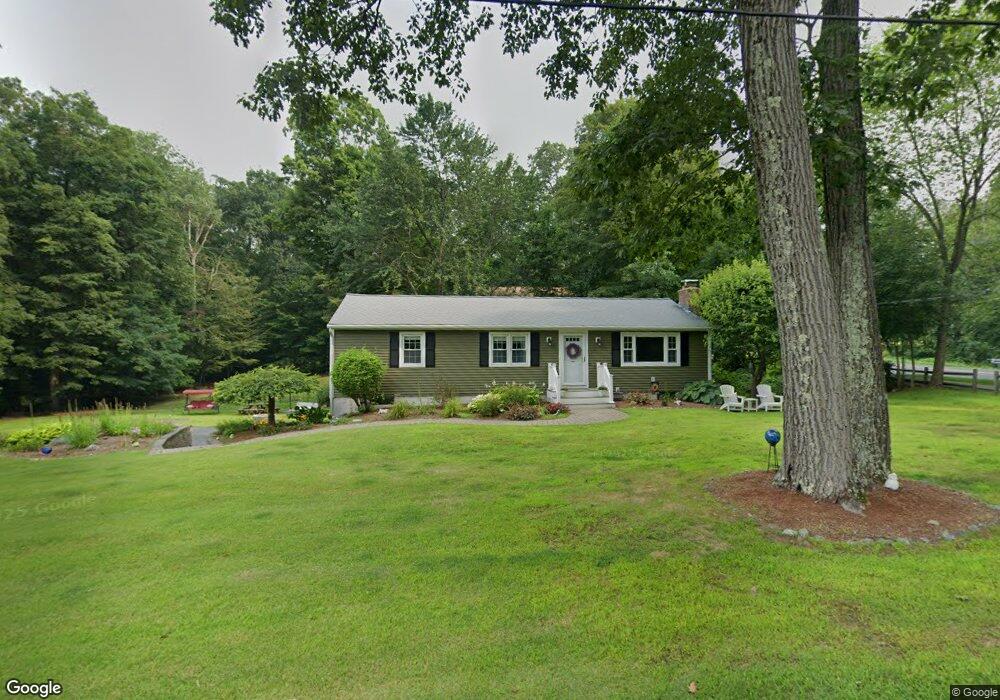
1 Gary Dr Wilbraham, MA 01095
Estimated Value: $353,000 - $431,000
3
Beds
2
Baths
1,152
Sq Ft
$337/Sq Ft
Est. Value
About This Home
This home is located at 1 Gary Dr, Wilbraham, MA 01095 and is currently estimated at $388,029, approximately $336 per square foot. 1 Gary Dr is a home located in Hampden County with nearby schools including Minnechaug Regional High School and Wilbraham & Monson Academy.
Ownership History
Date
Name
Owned For
Owner Type
Purchase Details
Closed on
Nov 22, 2004
Sold by
Bradford Darlene L
Bought by
Dupuis Kathleen M and Dupuis Scott E
Current Estimated Value
Home Financials for this Owner
Home Financials are based on the most recent Mortgage that was taken out on this home.
Original Mortgage
$140,000
Outstanding Balance
$69,958
Interest Rate
5.8%
Mortgage Type
Purchase Money Mortgage
Estimated Equity
$318,071
Create a Home Valuation Report for This Property
The Home Valuation Report is an in-depth analysis detailing your home's value as well as a comparison with similar homes in the area
Home Values in the Area
Average Home Value in this Area
Purchase History
| Date | Buyer | Sale Price | Title Company |
|---|---|---|---|
| Dupuis Kathleen M | $195,000 | -- |
Source: Public Records
Mortgage History
| Date | Status | Borrower | Loan Amount |
|---|---|---|---|
| Open | Dupuis Kathleen M | $140,000 |
Source: Public Records
Tax History Compared to Growth
Tax History
| Year | Tax Paid | Tax Assessment Tax Assessment Total Assessment is a certain percentage of the fair market value that is determined by local assessors to be the total taxable value of land and additions on the property. | Land | Improvement |
|---|---|---|---|---|
| 2025 | $5,616 | $314,100 | $96,900 | $217,200 |
| 2024 | $5,458 | $295,000 | $96,900 | $198,100 |
| 2023 | $4,983 | $289,300 | $96,900 | $192,400 |
| 2022 | $4,983 | $243,200 | $96,900 | $146,300 |
| 2021 | $4,661 | $203,000 | $104,300 | $98,700 |
| 2020 | $4,543 | $203,000 | $104,300 | $98,700 |
| 2019 | $4,460 | $204,600 | $104,300 | $100,300 |
| 2018 | $4,315 | $190,600 | $104,300 | $86,300 |
| 2017 | $4,193 | $190,600 | $104,300 | $86,300 |
| 2016 | $4,292 | $198,700 | $115,800 | $82,900 |
| 2015 | $4,149 | $198,700 | $115,800 | $82,900 |
Source: Public Records
Map
Nearby Homes