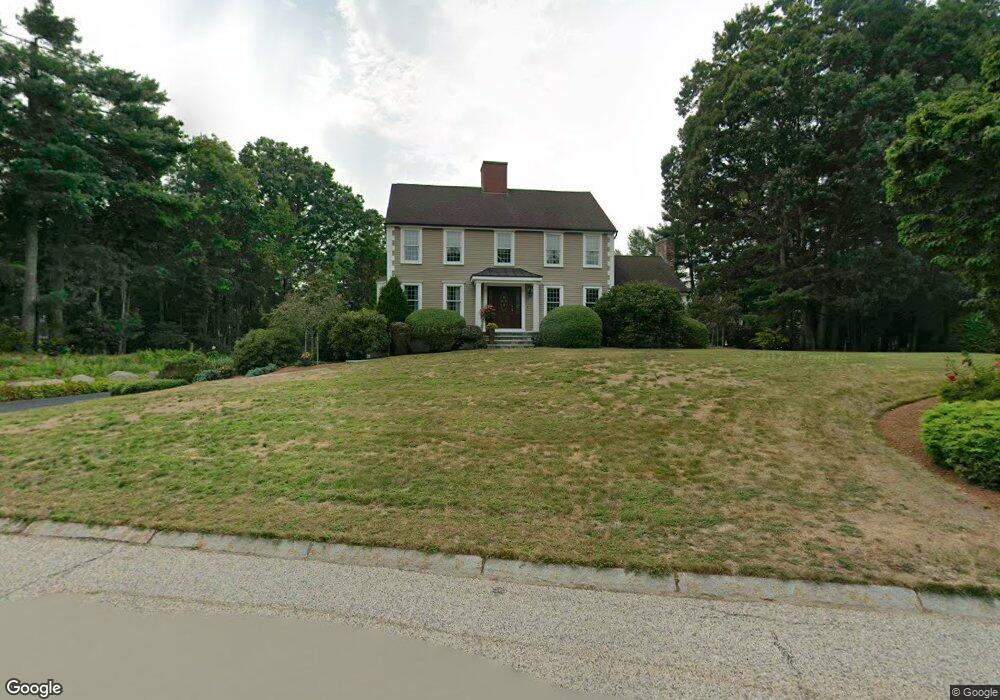
1 Gordon Ct Mansfield, MA 02048
Estimated Value: $815,879 - $963,000
3
Beds
3
Baths
2,208
Sq Ft
$409/Sq Ft
Est. Value
About This Home
This home is located at 1 Gordon Ct, Mansfield, MA 02048 and is currently estimated at $901,970, approximately $408 per square foot. 1 Gordon Ct is a home located in Bristol County with nearby schools including Everett W. Robinson Elementary School, Jordan/Jackson Elementary School, and Harold L. Qualters Middle School.
Ownership History
Date
Name
Owned For
Owner Type
Purchase Details
Closed on
Jul 30, 2007
Sold by
Miller Jean F and Tanous Jean F
Bought by
Tanous Jean F and Tanous John J
Current Estimated Value
Purchase Details
Closed on
Aug 31, 1989
Sold by
Brookdale Corp
Bought by
Tanous John J
Home Financials for this Owner
Home Financials are based on the most recent Mortgage that was taken out on this home.
Original Mortgage
$187,600
Interest Rate
9.7%
Mortgage Type
Purchase Money Mortgage
Create a Home Valuation Report for This Property
The Home Valuation Report is an in-depth analysis detailing your home's value as well as a comparison with similar homes in the area
Home Values in the Area
Average Home Value in this Area
Purchase History
| Date | Buyer | Sale Price | Title Company |
|---|---|---|---|
| Tanous Jean F | -- | -- | |
| Tanous John J | $254,584 | -- |
Source: Public Records
Mortgage History
| Date | Status | Borrower | Loan Amount |
|---|---|---|---|
| Previous Owner | Tanous John J | $181,000 | |
| Previous Owner | Tanous John J | $187,600 |
Source: Public Records
Tax History
| Year | Tax Paid | Tax Assessment Tax Assessment Total Assessment is a certain percentage of the fair market value that is determined by local assessors to be the total taxable value of land and additions on the property. | Land | Improvement |
|---|---|---|---|---|
| 2025 | $9,421 | $715,300 | $266,100 | $449,200 |
| 2024 | $9,275 | $687,000 | $278,100 | $408,900 |
| 2023 | $8,950 | $635,200 | $278,100 | $357,100 |
| 2022 | $8,598 | $566,800 | $257,400 | $309,400 |
| 2021 | $8,817 | $574,000 | $242,600 | $331,400 |
| 2020 | $8,681 | $565,200 | $242,600 | $322,600 |
| 2019 | $8,385 | $550,900 | $225,400 | $325,500 |
| 2018 | $7,707 | $534,600 | $214,900 | $319,700 |
| 2017 | $2,610 | $519,800 | $208,900 | $310,900 |
| 2016 | $8,009 | $519,700 | $229,000 | $290,700 |
| 2015 | $7,826 | $504,900 | $229,000 | $275,900 |
Source: Public Records
Map
Nearby Homes
- 128 Tremont St
- 24 Maverick Dr
- 17 Childs Ln
- 1769 West St
- 25 Shepherd St
- 150 Gilbert St
- 14 Claire Ave
- 401 South St
- 40 Treasure Island Rd
- 346 South St
- 9 Coach Rd
- 84 Messenger St
- 16 Treasure Island Rd
- 33 Colonial Way
- 25 Munroe Dr
- 46 Mirimichi St
- 166 Chauncy St
- 2 Oak St Unit 2B
- 38 Mirimichi St
- 356 Central St
Your Personal Tour Guide
Ask me questions while you tour the home.