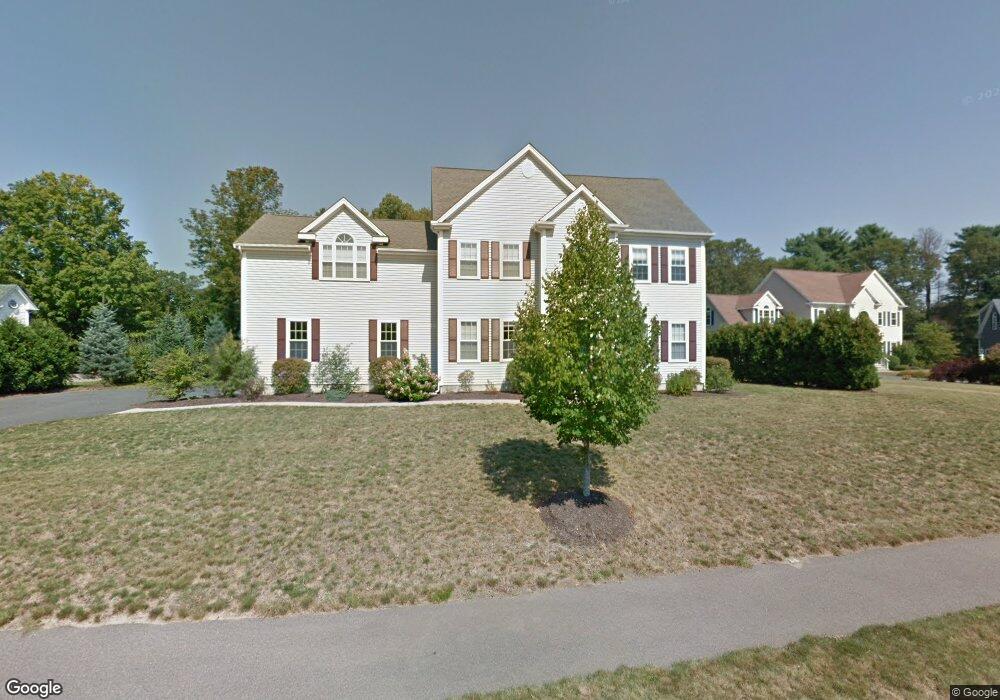
1 Grapevine Way Medway, MA 02053
Estimated Value: $984,000 - $1,056,000
4
Beds
3
Baths
3,019
Sq Ft
$337/Sq Ft
Est. Value
About This Home
This home is located at 1 Grapevine Way, Medway, MA 02053 and is currently estimated at $1,016,670, approximately $336 per square foot. 1 Grapevine Way is a home located in Norfolk County with nearby schools including John D. McGovern Elementary School, Burke-Memorial Elementary, and Medway Middle School.
Ownership History
Date
Name
Owned For
Owner Type
Purchase Details
Closed on
Jun 27, 2005
Sold by
Rojee & Leland Homes I
Bought by
Sanborn Laurie L and Sanborn Richard A
Current Estimated Value
Home Financials for this Owner
Home Financials are based on the most recent Mortgage that was taken out on this home.
Original Mortgage
$552,000
Outstanding Balance
$291,123
Interest Rate
5.82%
Mortgage Type
Purchase Money Mortgage
Estimated Equity
$725,547
Create a Home Valuation Report for This Property
The Home Valuation Report is an in-depth analysis detailing your home's value as well as a comparison with similar homes in the area
Home Values in the Area
Average Home Value in this Area
Purchase History
| Date | Buyer | Sale Price | Title Company |
|---|---|---|---|
| Sanborn Laurie L | $690,000 | -- |
Source: Public Records
Mortgage History
| Date | Status | Borrower | Loan Amount |
|---|---|---|---|
| Open | Sanborn Laurie L | $552,000 | |
| Closed | Sanborn Laurie L | $69,000 |
Source: Public Records
Tax History Compared to Growth
Tax History
| Year | Tax Paid | Tax Assessment Tax Assessment Total Assessment is a certain percentage of the fair market value that is determined by local assessors to be the total taxable value of land and additions on the property. | Land | Improvement |
|---|---|---|---|---|
| 2025 | $12,184 | $855,000 | $323,400 | $531,600 |
| 2024 | $12,312 | $855,000 | $323,400 | $531,600 |
| 2023 | $11,671 | $732,200 | $294,300 | $437,900 |
| 2022 | $10,908 | $644,300 | $217,600 | $426,700 |
| 2021 | $10,995 | $629,700 | $203,100 | $426,600 |
| 2020 | $10,854 | $620,200 | $203,100 | $417,100 |
| 2019 | $10,345 | $609,600 | $194,800 | $414,800 |
| 2018 | $10,645 | $602,800 | $194,800 | $408,000 |
| 2017 | $10,297 | $574,600 | $186,600 | $388,000 |
| 2016 | $10,218 | $564,200 | $176,200 | $388,000 |
| 2015 | $10,171 | $557,600 | $176,200 | $381,400 |
| 2014 | $9,164 | $486,400 | $176,200 | $310,200 |
Source: Public Records
Map
Nearby Homes