
Seller's Agent in 2026
Cathy Clay
Howard Hanna Allen Tate Co. - Greenville Downtown
(864) 684-8052
11 in this area
110 Total Sales
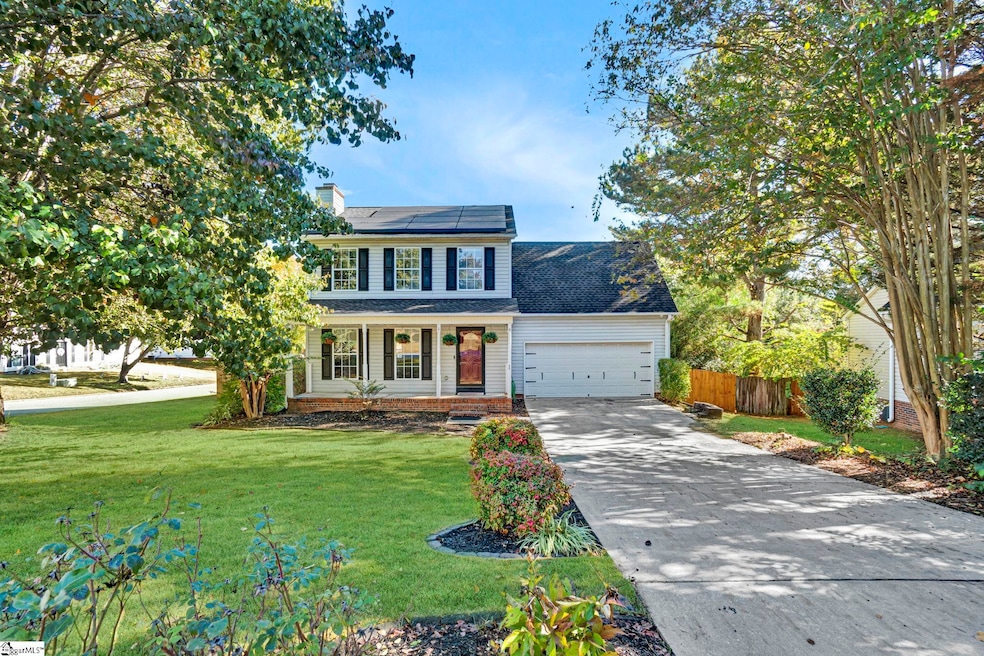
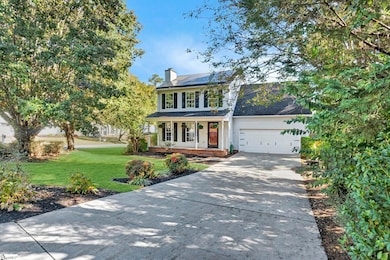
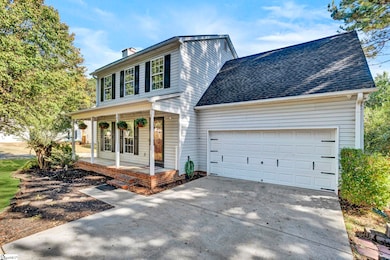
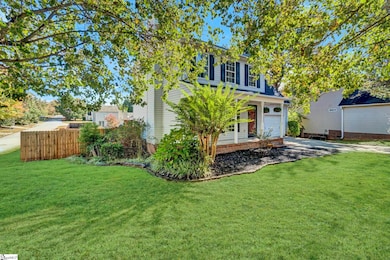
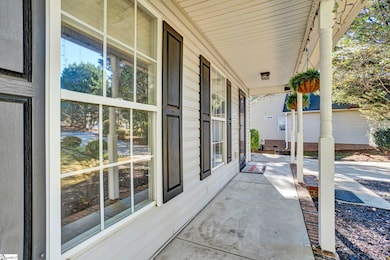
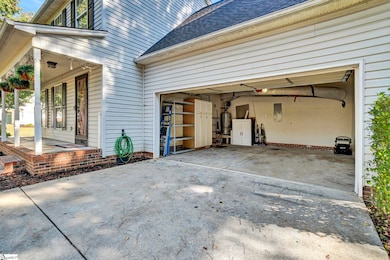
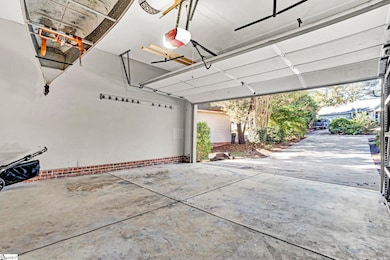
REDUCED FOR THE HOLIDAYS!!! This remarkable 4 bedroom 2.5 bath home is now ready for a new family in the highly desirable Standing Springs Estates community. If location is on the top of your wish list, this community is located minutes to 385 and all sorts of amenities. This home features a 2 story floor plan with all bedrooms and 2 full baths upstairs so you can be on the same floor with your children or guests. The main floor features a spacious layout, plenty of room for family gatherings or entertaining friends and has a beautiful hickory hand scraped hardwood floor. The kitchen features lots of cabinets, a closet style pantry, a beautiful tile backsplash, recently added under cabinet lighting and a coffee bar with a mini fridge/cooler. The dining room and living rooms are both spacious and inviting while the living room features a water fountain on the wall that will remain with the home. The waterfall sets such a relaxing atmosphere. The sellers took a hall closet and turned it into an audio space for all your media boxes etc. with cabinets and shelves for extra storage. Lots of new electrical outlets and lighting throughout the home. There are several security cameras that will remain with the home and can be used by downloading the corresponding app. Upstairs you will find 4 spacious bedrooms and 2 full baths. Once a 3 Bedroom 2.5 bath home, the current owners have added a closet to the previous bonus room to create a fourth bedroom and added an adorable little secret play area for kids. The master bedroom features an en-suite bath with a tub/shower combo and a beautiful vanity with quartz countertops. The outdoor space of this home is just as great as the inside as you will adore the rocking chair front porch and huge back deck perfect for grilling and enjoying the outdoors. Sit on the back deck and enjoy your morning coffee or your evenings roasting marshmallows around the firepit. The backyard is fully fenced in with a brand new privacy fence with a double gate door perfect for letting the kids or pets roam free. In the spring, the Hostas, Rhododendrons, Hydrangeas, Roses, Crepe Myrtles, Peonies and Daffodils are breathtaking and comes back year after year. The underneath of the deck has been closed in to provide some storage. 1 Greyleaf Court has a solar panel system that has drastically reduced the utility cost. The panel are leased and will need to be taken over by the buyer. Sellers have added so many amazing features to this home during ownership and are so excited to pass this home onto a new family.
Last Agent to Sell the Property
Howard Hanna Allen Tate Co. - Greenville Downtown License #106308 Listed on: 10/31/2025
| Date | Type | Sale Price | Title Company |
|---|---|---|---|
| Interfamily Deed Transfer | -- | None Available | |
| Deed | $232,000 | None Available | |
| Interfamily Deed Transfer | -- | -- |
| Date | Status | Loan Amount | Loan Type |
|---|---|---|---|
| Open | $227,797 | FHA | |
| Previous Owner | $131,237 | FHA |
| Date | Event | Price | List to Sale | Price per Sq Ft |
|---|---|---|---|---|
| 03/13/2026 03/13/26 | Sold | $299,900 | 0.0% | $214 / Sq Ft |
| 01/18/2026 01/18/26 | Price Changed | $299,900 | -3.2% | $214 / Sq Ft |
| 11/21/2025 11/21/25 | Price Changed | $309,900 | -3.1% | $221 / Sq Ft |
| 10/31/2025 10/31/25 | For Sale | $319,900 | -- | $229 / Sq Ft |
| Year | Tax Paid | Tax Assessment Tax Assessment Total Assessment is a certain percentage of the fair market value that is determined by local assessors to be the total taxable value of land and additions on the property. | Land | Improvement |
|---|---|---|---|---|
| 2025 | $1,496 | $10,500 | $2,150 | $8,350 |
| 2024 | $1,496 | $13,700 | $1,500 | $12,200 |
| 2023 | $4,311 | $13,700 | $1,500 | $12,200 |
| 2022 | $4,112 | $13,700 | $1,500 | $12,200 |
| 2021 | $826 | $5,320 | $830 | $4,490 |
| 2020 | $764 | $4,630 | $720 | $3,910 |
| 2019 | $764 | $4,630 | $720 | $3,910 |
| 2018 | $809 | $4,630 | $720 | $3,910 |
| 2017 | $810 | $4,630 | $720 | $3,910 |
| 2016 | $775 | $115,710 | $18,000 | $97,710 |
| 2015 | $776 | $115,710 | $18,000 | $97,710 |
| 2014 | $783 | $123,250 | $18,000 | $105,250 |
Seller's Agent in 2026
Cathy Clay
Howard Hanna Allen Tate Co. - Greenville Downtown
(864) 684-8052
11 in this area
110 Total Sales
T
Buyer's Agent in 2026
Trey Adkins
EXP Realty LLC
(864) 612-7234
5 in this area
22 Total Sales
Source: Greater Greenville Association of REALTORS®
MLS Number: 1573626
APN: 0574.20-01-082.00
Disclaimer: Certain information contained herein is derived from information provided by parties other than Homes.com. All information provided is deemed reliable, but is not guaranteed to be accurate and should be independently verified.
![]() IDX information is provided exclusively for personal, non-commercial use, and may not be used for any purpose other than to identify prospective properties consumers may be interested in purchasing. Information is deemed reliable but not guaranteed.
IDX information is provided exclusively for personal, non-commercial use, and may not be used for any purpose other than to identify prospective properties consumers may be interested in purchasing. Information is deemed reliable but not guaranteed.
Ask me questions while you tour the home.