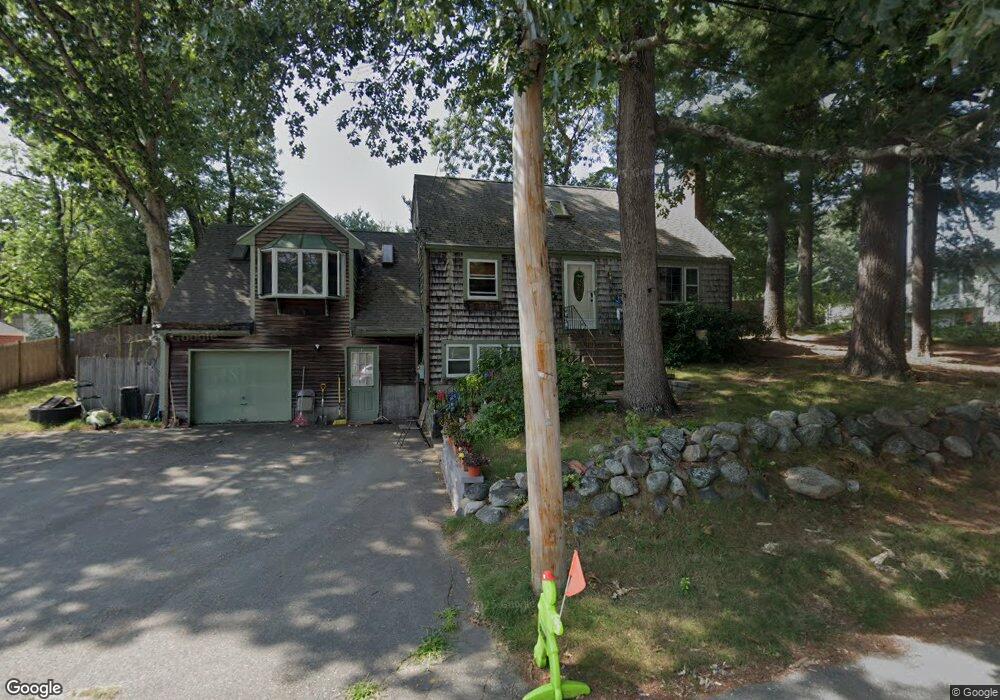
1 Hawthorne Rd Holbrook, MA 02343
Estimated Value: $614,384 - $672,000
5
Beds
3
Baths
2,695
Sq Ft
$238/Sq Ft
Est. Value
About This Home
This home is located at 1 Hawthorne Rd, Holbrook, MA 02343 and is currently estimated at $641,346, approximately $237 per square foot. 1 Hawthorne Rd is a home located in Norfolk County with nearby schools including John F. Kennedy Elementary School, Holbrook Middle High School, and Boston Higashi School.
Ownership History
Date
Name
Owned For
Owner Type
Purchase Details
Closed on
Mar 14, 2008
Sold by
Nee Thomas D
Bought by
Tynes Jonathan R and Pauleon Marjorie
Current Estimated Value
Home Financials for this Owner
Home Financials are based on the most recent Mortgage that was taken out on this home.
Original Mortgage
$295,365
Outstanding Balance
$183,810
Interest Rate
5.72%
Mortgage Type
Purchase Money Mortgage
Estimated Equity
$457,536
Create a Home Valuation Report for This Property
The Home Valuation Report is an in-depth analysis detailing your home's value as well as a comparison with similar homes in the area
Home Values in the Area
Average Home Value in this Area
Purchase History
| Date | Buyer | Sale Price | Title Company |
|---|---|---|---|
| Tynes Jonathan R | $300,000 | -- | |
| Tynes Jonathan R | $300,000 | -- | |
| Tynes Jonathan R | $300,000 | -- |
Source: Public Records
Mortgage History
| Date | Status | Borrower | Loan Amount |
|---|---|---|---|
| Open | Tynes Jonathan R | $295,365 | |
| Closed | Tynes Jonathan R | $295,365 | |
| Previous Owner | Tynes Jonathan R | $50,000 | |
| Previous Owner | Tynes Jonathan R | $30,000 |
Source: Public Records
Tax History
| Year | Tax Paid | Tax Assessment Tax Assessment Total Assessment is a certain percentage of the fair market value that is determined by local assessors to be the total taxable value of land and additions on the property. | Land | Improvement |
|---|---|---|---|---|
| 2025 | $59 | $446,100 | $103,300 | $342,800 |
| 2024 | $5,938 | $441,800 | $103,200 | $338,600 |
| 2023 | $6,355 | $413,200 | $93,800 | $319,400 |
| 2022 | $5,694 | $345,300 | $85,300 | $260,000 |
| 2021 | $5,645 | $327,800 | $77,400 | $250,400 |
| 2020 | $5,625 | $306,200 | $75,000 | $231,200 |
| 2019 | $5,680 | $291,900 | $70,200 | $221,700 |
| 2018 | $5,767 | $279,000 | $65,000 | $214,000 |
| 2017 | $5,465 | $261,500 | $59,000 | $202,500 |
| 2016 | $5,032 | $256,200 | $57,500 | $198,700 |
| 2015 | $4,768 | $249,900 | $55,000 | $194,900 |
| 2014 | $4,691 | $249,900 | $55,000 | $194,900 |
Source: Public Records
Map
Nearby Homes
- 27 Valley Rd
- 14 Leonard Ln
- 660 S Franklin St
- 375 S Franklin St Unit 1
- 68 Spring St
- 52 Quincy St
- 719 S Franklin St Unit C Block 1
- 24 Reeds Ln
- 14 Washington Cir
- 95 Rindone St
- 12 Hamilton Way
- 88 Roseen Rd
- 0 Payson Ave
- 181 S Franklin St Unit 102
- 181 S Franklin St Unit 206
- 152 S Franklin St
- 58 Chandler St
- 7 Oakwood Ave
- 1004 S Franklin St
- 68 Robbins St
Your Personal Tour Guide
Ask me questions while you tour the home.