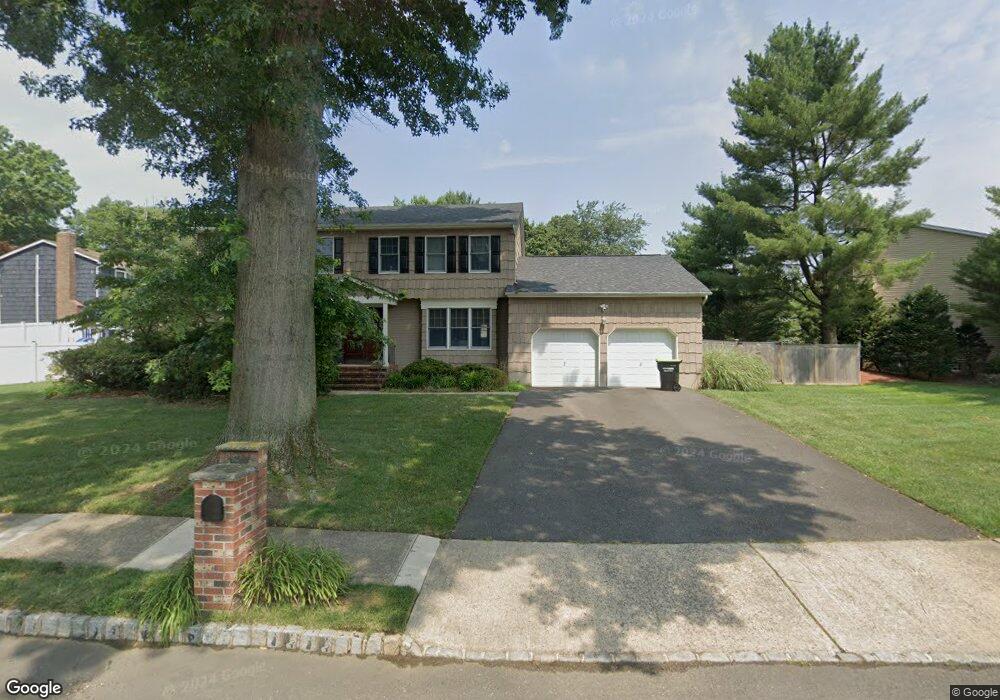
1 Hemlock Ln Marlboro, NJ 07746
Estimated Value: $1,057,079 - $1,127,000
4
Beds
2
Baths
3,386
Sq Ft
$325/Sq Ft
Est. Value
About This Home
This home is located at 1 Hemlock Ln, Marlboro, NJ 07746 and is currently estimated at $1,100,270, approximately $324 per square foot. 1 Hemlock Ln is a home located in Monmouth County with nearby schools including Asher Holmes Elementary School, Marlboro Middle School, and Marlboro High School.
Ownership History
Date
Name
Owned For
Owner Type
Purchase Details
Closed on
Sep 8, 2021
Sold by
Kellie Weilheimer and Kellie Gary Weilheimer
Bought by
Elkrief Justin and Hagoel Tamara Jane
Current Estimated Value
Home Financials for this Owner
Home Financials are based on the most recent Mortgage that was taken out on this home.
Original Mortgage
$660,000
Outstanding Balance
$503,782
Interest Rate
2.1%
Mortgage Type
New Conventional
Estimated Equity
$596,488
Purchase Details
Closed on
Mar 15, 2020
Sold by
Wellheimer Gary and Wellheimer Kellie
Bought by
Wellheimer Kellie
Purchase Details
Closed on
Jun 2, 1999
Sold by
Lindenman Barry
Bought by
Weilheim Gary and Weilheim Kellie
Home Financials for this Owner
Home Financials are based on the most recent Mortgage that was taken out on this home.
Original Mortgage
$240,000
Interest Rate
6.9%
Create a Home Valuation Report for This Property
The Home Valuation Report is an in-depth analysis detailing your home's value as well as a comparison with similar homes in the area
Home Values in the Area
Average Home Value in this Area
Purchase History
| Date | Buyer | Sale Price | Title Company |
|---|---|---|---|
| Elkrief Justin | $825,000 | All Ahead Title Agency | |
| Wellheimer Kellie | -- | Quality Ttl & Abstract Agcy | |
| Weilheim Gary | $312,500 | -- |
Source: Public Records
Mortgage History
| Date | Status | Borrower | Loan Amount |
|---|---|---|---|
| Open | Elkrief Justin | $660,000 | |
| Previous Owner | Weilheim Gary | $240,000 |
Source: Public Records
Tax History Compared to Growth
Tax History
| Year | Tax Paid | Tax Assessment Tax Assessment Total Assessment is a certain percentage of the fair market value that is determined by local assessors to be the total taxable value of land and additions on the property. | Land | Improvement |
|---|---|---|---|---|
| 2025 | $14,405 | $577,600 | $185,300 | $392,300 |
| 2024 | $13,770 | $577,600 | $185,300 | $392,300 |
| 2023 | $13,770 | $577,600 | $185,300 | $392,300 |
| 2022 | $13,418 | $577,600 | $185,300 | $392,300 |
| 2021 | $13,285 | $577,600 | $185,300 | $392,300 |
| 2020 | $13,279 | $577,600 | $185,300 | $392,300 |
| 2019 | $13,285 | $577,600 | $185,300 | $392,300 |
| 2018 | $13,060 | $577,600 | $185,300 | $392,300 |
| 2017 | $12,805 | $577,600 | $185,300 | $392,300 |
| 2016 | $12,753 | $577,600 | $185,300 | $392,300 |
| 2015 | $12,798 | $588,400 | $185,300 | $403,100 |
| 2014 | $11,889 | $540,900 | $155,300 | $385,600 |
Source: Public Records
Map
Nearby Homes
- 11 Woodview Dr
- 23 Eli Cir
- 34 Brookside Cir
- 37 Willow Grove Way
- 126 Wyncrest Rd
- 4 Terrace Dr
- 21 Wickatunk Rd
- 25 Highland Dr
- 54 Tracy Dr
- 308 Pilot St
- 218 Medford Ct Unit A
- 69 Caldwell Terrace
- 5 Homestead Cir
- 7 Syngle Way
- 236 Medford Ct Unit G
- 41 Longstreet Rd
- 205 Covered Bridge Blvd Unit K
- 39 Longstreet Rd
- 40 Caldwell Terrace
- 39 Homestead Cir