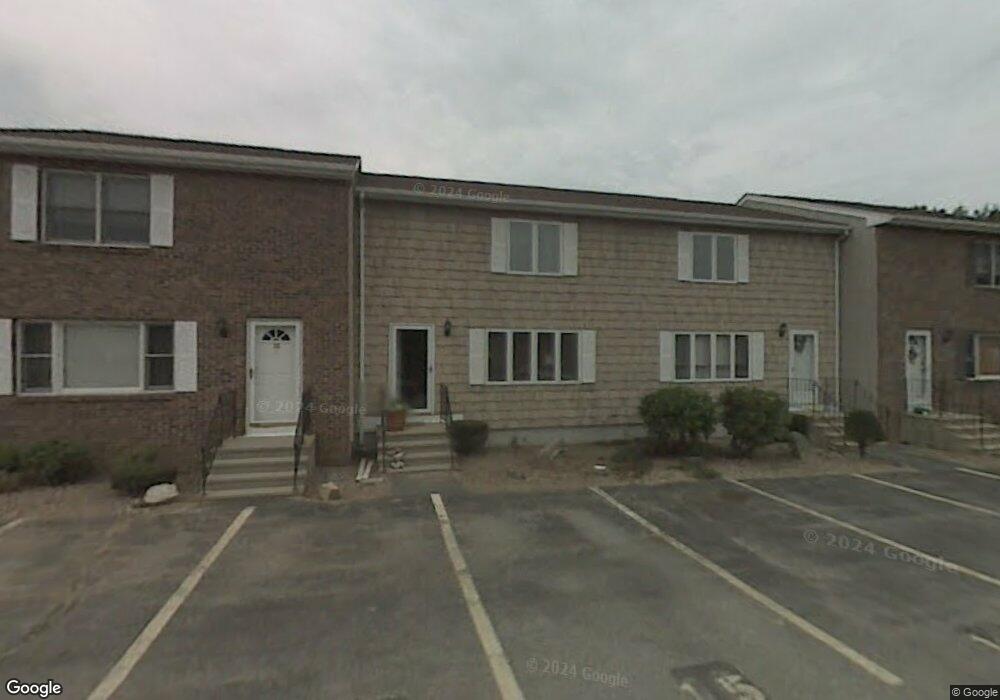
1 Highcrest Park Unit 13 Webster, MA 01570
Estimated Value: $279,000 - $303,559
2
Beds
2
Baths
1,536
Sq Ft
$189/Sq Ft
Est. Value
About This Home
This home is located at 1 Highcrest Park Unit 13, Webster, MA 01570 and is currently estimated at $290,390, approximately $189 per square foot. 1 Highcrest Park Unit 13 is a home located in Worcester County with nearby schools including Park Avenue Elementary School, Webster Middle School, and Bartlett High School.
Ownership History
Date
Name
Owned For
Owner Type
Purchase Details
Closed on
Jan 7, 2019
Sold by
Us Bank Na Tr
Bought by
Edwin Edwin W and Edwin Laprade T
Current Estimated Value
Purchase Details
Closed on
Jul 9, 2018
Sold by
Richardson Peter E
Bought by
Us Bank Na Tr
Purchase Details
Closed on
Jul 20, 2005
Sold by
Babcock Trisha
Bought by
Richardson Peter E
Home Financials for this Owner
Home Financials are based on the most recent Mortgage that was taken out on this home.
Original Mortgage
$147,200
Interest Rate
5.59%
Mortgage Type
Purchase Money Mortgage
Purchase Details
Closed on
May 3, 2004
Sold by
Farrar Brian and Pedersen Cristy
Bought by
Babcock Trisha
Home Financials for this Owner
Home Financials are based on the most recent Mortgage that was taken out on this home.
Original Mortgage
$135,920
Interest Rate
5.36%
Mortgage Type
Purchase Money Mortgage
Purchase Details
Closed on
Jan 4, 2002
Sold by
Franke Robyn J
Bought by
Farrar Brian and Pederson Cristy
Home Financials for this Owner
Home Financials are based on the most recent Mortgage that was taken out on this home.
Original Mortgage
$106,650
Interest Rate
6.72%
Mortgage Type
Purchase Money Mortgage
Create a Home Valuation Report for This Property
The Home Valuation Report is an in-depth analysis detailing your home's value as well as a comparison with similar homes in the area
Home Values in the Area
Average Home Value in this Area
Purchase History
| Date | Buyer | Sale Price | Title Company |
|---|---|---|---|
| Edwin Edwin W | $149,900 | -- | |
| Us Bank Na Tr | $115,000 | -- | |
| Richardson Peter E | $184,000 | -- | |
| Babcock Trisha | $169,900 | -- | |
| Farrar Brian | $109,950 | -- |
Source: Public Records
Mortgage History
| Date | Status | Borrower | Loan Amount |
|---|---|---|---|
| Previous Owner | Richardson Peter E | $147,200 | |
| Previous Owner | Babcock Trisha | $135,920 | |
| Previous Owner | Farrar Brian | $106,650 |
Source: Public Records
Tax History
| Year | Tax Paid | Tax Assessment Tax Assessment Total Assessment is a certain percentage of the fair market value that is determined by local assessors to be the total taxable value of land and additions on the property. | Land | Improvement |
|---|---|---|---|---|
| 2025 | $3,139 | $264,200 | $0 | $264,200 |
| 2024 | $3,010 | $247,100 | $0 | $247,100 |
| 2023 | $2,464 | $197,100 | $0 | $197,100 |
| 2022 | $2,126 | $152,300 | $0 | $152,300 |
| 2021 | $2,155 | $142,700 | $0 | $142,700 |
| 2020 | $1,997 | $132,600 | $0 | $132,600 |
| 2019 | $2,020 | $131,800 | $0 | $131,800 |
| 2018 | $1,990 | $129,300 | $0 | $129,300 |
| 2017 | $1,941 | $128,300 | $0 | $128,300 |
| 2016 | $1,897 | $125,300 | $0 | $125,300 |
| 2015 | $1,804 | $122,900 | $0 | $122,900 |
Source: Public Records
Map
Nearby Homes
- 4 Highcrest Park
- 3 Highcrest Park
- 2 Highcrest Park
- 1 Highcrest Park
- 1 Highcrest Park Unit 1
- 425 High St
- 5 Highcrest Park
- 20 Highcrest Park
- 20 Highcrest Park Unit 20
- 423 High St
- 8 Highcrest Park
- 8 Highcrest Park Unit 8
- 8 Highcrest Park Unit 8-3
- 6 Highcrest Park
- 6 Highcrest Park Unit 6
- 421 High St
- 5 Emmanuel Ave
- 14 Highcrest Park Unit 14
- 14 Highcrest Park
- 13 Highcrest Park
Your Personal Tour Guide
Ask me questions while you tour the home.