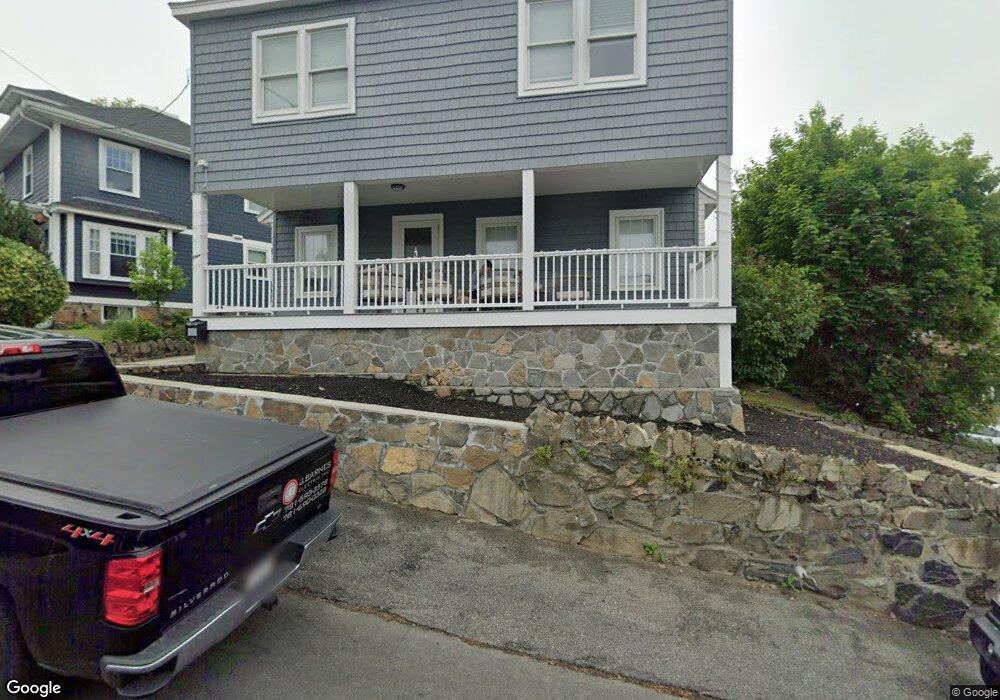
1 Hillcrest Cir Swampscott, MA 01907
Estimated Value: $708,944 - $764,000
3
Beds
2
Baths
1,794
Sq Ft
$411/Sq Ft
Est. Value
About This Home
This home is located at 1 Hillcrest Cir, Swampscott, MA 01907 and is currently estimated at $737,986, approximately $411 per square foot. 1 Hillcrest Cir is a home located in Essex County with nearby schools including Swampscott Middle School and Swampscott High School.
Ownership History
Date
Name
Owned For
Owner Type
Purchase Details
Closed on
Oct 21, 2020
Sold by
Costello-Byrne Elaina
Bought by
Barnes John A and Costello-Byrne Elaina
Current Estimated Value
Purchase Details
Closed on
Sep 30, 2020
Sold by
Costello-Byrne Elaina and Byrne Jason
Bought by
Costello Elaina
Purchase Details
Closed on
Sep 1, 2006
Sold by
Hyde Marie A and Munnelly Marie A
Bought by
Byrne Jason and Costello Elaina
Home Financials for this Owner
Home Financials are based on the most recent Mortgage that was taken out on this home.
Original Mortgage
$297,600
Interest Rate
6.83%
Mortgage Type
Purchase Money Mortgage
Purchase Details
Closed on
May 27, 1999
Sold by
Lomax Jenifer M and Lomax James T
Bought by
Munnelly Kevin D and Hyde Marie A
Purchase Details
Closed on
Sep 28, 1995
Sold by
Sanders Michael and Sanders Ann
Bought by
Maiorani Jennifer and Mclaughlin Mark F
Purchase Details
Closed on
Aug 16, 1988
Sold by
Patrikis Theo
Bought by
Schwartz Jonathan S
Create a Home Valuation Report for This Property
The Home Valuation Report is an in-depth analysis detailing your home's value as well as a comparison with similar homes in the area
Home Values in the Area
Average Home Value in this Area
Purchase History
| Date | Buyer | Sale Price | Title Company |
|---|---|---|---|
| Barnes John A | -- | None Available | |
| Barnes John A | -- | None Available | |
| Barnes John A | -- | None Available | |
| Costello Elaina | -- | None Available | |
| Costello Elaina | -- | None Available | |
| Costello Elaina | -- | None Available | |
| Byrne Jason | $372,000 | -- | |
| Byrne Jason | $372,000 | -- | |
| Munnelly Kevin D | $219,900 | -- | |
| Munnelly Kevin D | $219,900 | -- | |
| Maiorani Jennifer | $170,000 | -- | |
| Maiorani Jennifer | $170,000 | -- | |
| Schwartz Jonathan S | $185,000 | -- |
Source: Public Records
Mortgage History
| Date | Status | Borrower | Loan Amount |
|---|---|---|---|
| Previous Owner | Schwartz Jonathan S | $281,700 | |
| Previous Owner | Schwartz Jonathan S | $297,600 |
Source: Public Records
Tax History Compared to Growth
Tax History
| Year | Tax Paid | Tax Assessment Tax Assessment Total Assessment is a certain percentage of the fair market value that is determined by local assessors to be the total taxable value of land and additions on the property. | Land | Improvement |
|---|---|---|---|---|
| 2025 | $6,973 | $607,900 | $227,600 | $380,300 |
| 2024 | $6,793 | $591,200 | $216,700 | $374,500 |
| 2023 | $6,549 | $557,800 | $216,700 | $341,100 |
| 2022 | $6,067 | $472,900 | $184,600 | $288,300 |
| 2021 | $5,888 | $426,700 | $144,500 | $282,200 |
| 2020 | $6,043 | $422,600 | $144,500 | $278,100 |
| 2019 | $6,179 | $406,500 | $128,400 | $278,100 |
| 2018 | $5,925 | $370,300 | $112,400 | $257,900 |
| 2017 | $5,968 | $342,000 | $104,400 | $237,600 |
| 2016 | $5,786 | $333,900 | $96,300 | $237,600 |
| 2015 | $5,726 | $333,900 | $96,300 | $237,600 |
| 2014 | $5,331 | $285,100 | $80,300 | $204,800 |
Source: Public Records
Map
Nearby Homes
- 106 Norfolk Ave
- 80 Norfolk Ave Unit 1
- 44 Cherry St Unit 2
- 100 Burpee Rd
- 76 Stetson Ave
- 29-31 Essex Ave Unit 2
- 189 Burrill St Unit 2
- 98 Paradise Rd
- 51 Barnstable St
- 30 Paradise Rd
- 133 Eastern Ave Unit 8
- 59 Essex St Unit 59B
- 35 Columbia Ave
- 108-110 Burrill St Unit 1
- 7-9 Rock Ave
- 140 Elmwood Rd
- 28 Claremont Terrace Unit 4
- 28 Claremont Terrace Unit 6
- 306 Paradise Rd
- 26 Groveland St
- 11 Hillcrest Cir
- 3 Hillcrest Cir
- 34 Hillcrest Cir
- 34 Hillcrest Cir Unit 1
- 5 Hillcrest Cir
- 6 Hillcrest Cir
- 8 Hillcrest Cir
- 2 Hillcrest Cir
- 10 Hillcrest Cir
- 10 Burpee Rd
- 10 Burpee Rd Unit 10
- 14 Burpee Rd Unit 16
- 7 Hillcrest Cir
- 32 Hillcrest Cir
- 146 Essex St Unit 148
- 6 Burpee Rd
- 12 Hillcrest Cir
- 16 Hillcrest Cir
- 16 Hillcrest Cir Unit 1
- 16 Hillcrest Cir Unit 2