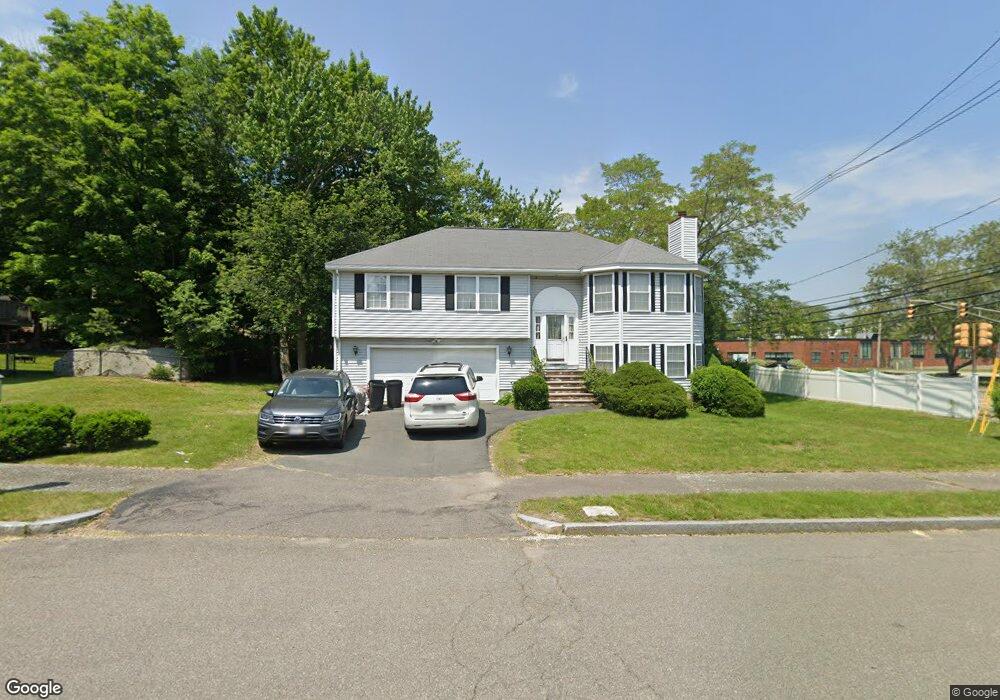
1 Honey Ln Peabody, MA 01960
South Peabody NeighborhoodEstimated Value: $782,950 - $823,000
3
Beds
3
Baths
1,934
Sq Ft
$413/Sq Ft
Est. Value
About This Home
This home is located at 1 Honey Ln, Peabody, MA 01960 and is currently estimated at $799,488, approximately $413 per square foot. 1 Honey Ln is a home located in Essex County with nearby schools including Peabody Veterans Memorial High School, Our Lady Of Assumption School, and St John The Baptist School.
Ownership History
Date
Name
Owned For
Owner Type
Purchase Details
Closed on
Dec 27, 2002
Sold by
Stpierre Ken and Stpierre Kenneth J
Bought by
Bouchard John and Bouchard Candida
Current Estimated Value
Purchase Details
Closed on
Oct 28, 1996
Sold by
Old Mill Re Corp
Bought by
Stpierre Kenneth J and Archambault Kristine
Create a Home Valuation Report for This Property
The Home Valuation Report is an in-depth analysis detailing your home's value as well as a comparison with similar homes in the area
Home Values in the Area
Average Home Value in this Area
Purchase History
| Date | Buyer | Sale Price | Title Company |
|---|---|---|---|
| Bouchard John | $409,000 | -- | |
| Stpierre Kenneth J | $213,900 | -- |
Source: Public Records
Mortgage History
| Date | Status | Borrower | Loan Amount |
|---|---|---|---|
| Open | Stpierre Kenneth J | $275,000 | |
| Closed | Stpierre Kenneth J | $100,000 | |
| Closed | Stpierre Kenneth J | $30,000 |
Source: Public Records
Tax History Compared to Growth
Tax History
| Year | Tax Paid | Tax Assessment Tax Assessment Total Assessment is a certain percentage of the fair market value that is determined by local assessors to be the total taxable value of land and additions on the property. | Land | Improvement |
|---|---|---|---|---|
| 2025 | $6,538 | $706,000 | $244,900 | $461,100 |
| 2024 | $6,189 | $678,600 | $244,900 | $433,700 |
| 2023 | $5,985 | $628,700 | $218,700 | $410,000 |
| 2022 | $5,576 | $552,100 | $195,300 | $356,800 |
| 2021 | $5,374 | $512,300 | $177,600 | $334,700 |
| 2020 | $5,594 | $520,900 | $177,600 | $343,300 |
| 2019 | $5,039 | $457,700 | $177,600 | $280,100 |
| 2018 | $5,062 | $441,700 | $161,400 | $280,300 |
| 2017 | $4,909 | $417,400 | $161,400 | $256,000 |
| 2016 | $4,789 | $401,800 | $161,400 | $240,400 |
| 2015 | $4,632 | $376,600 | $157,400 | $219,200 |
Source: Public Records
Map
Nearby Homes
- 17 Janet Ln
- 5 Louis Rd
- 3 Ralph Rd
- 16 Sarah's Way
- 12 Mansfield St
- 28 Elmwood Cir
- 325 Den Quarry Rd
- 33 Ritchie Rd
- 1200 Salem St Unit 127
- 1200 Salem St Unit 182
- 50 Cumberland Cir
- 5 Quarry Terrace
- 6 Christopher Terrace
- 714 Lynnfield St
- 217 Cedar Brook Rd
- 1100 Salem St Unit 58
- 1100 Salem St Unit 46
- 1100 Salem St Unit 93
- 1100 Salem St Unit 75
- 10 Standish Way