Estimated Value: $805,839 - $855,000
3
Beds
2
Baths
1,976
Sq Ft
$422/Sq Ft
Est. Value
About This Home
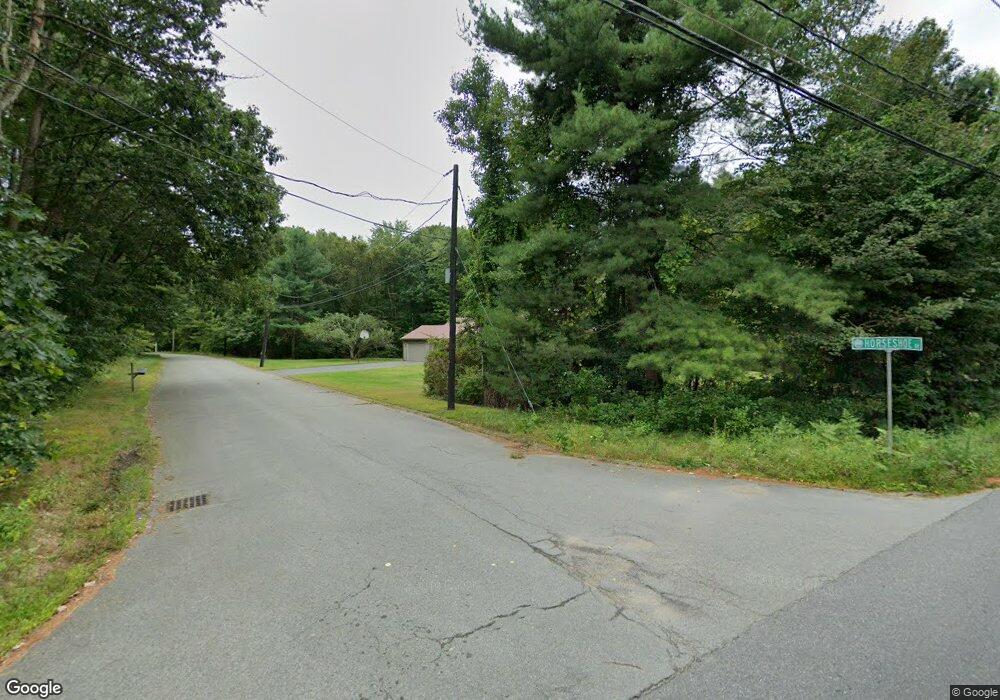
This home is located at 1 Horseshoe Dr, Acton, MA 01720 and is currently estimated at $833,210, approximately $421 per square foot. 1 Horseshoe Dr is a home located in Middlesex County with nearby schools including Acton-Boxborough Regional High School, Nashoba Brooks School, and Concord Academy.
Ownership History
Date
Name
Owned For
Owner Type
Purchase Details
Closed on
Aug 8, 2023
Sold by
Mcmanus Paul E
Bought by
2023 Mcmanus Ft and Mcmanus
Current Estimated Value
Purchase Details
Closed on
Jul 1, 1983
Bought by
Mcmanus Paul E
Create a Home Valuation Report for This Property
The Home Valuation Report is an in-depth analysis detailing your home's value as well as a comparison with similar homes in the area
Home Values in the Area
Average Home Value in this Area
Purchase History
| Date | Buyer | Sale Price | Title Company |
|---|---|---|---|
| 2023 Mcmanus Ft | -- | None Available | |
| Mcmanus Paul E | -- | -- |
Source: Public Records
Mortgage History
| Date | Status | Borrower | Loan Amount |
|---|---|---|---|
| Previous Owner | Mcmanus Paul E | $164,000 | |
| Previous Owner | Mcmanus Paul E | $187,600 | |
| Previous Owner | Mcmanus Paul E | $80,000 |
Source: Public Records
Tax History
| Year | Tax Paid | Tax Assessment Tax Assessment Total Assessment is a certain percentage of the fair market value that is determined by local assessors to be the total taxable value of land and additions on the property. | Land | Improvement |
|---|---|---|---|---|
| 2025 | $12,706 | $740,900 | $344,500 | $396,400 |
| 2024 | $12,047 | $722,700 | $344,500 | $378,200 |
| 2023 | $11,686 | $665,500 | $313,200 | $352,300 |
| 2022 | $11,666 | $599,800 | $272,400 | $327,400 |
| 2021 | $11,145 | $550,900 | $252,500 | $298,400 |
| 2020 | $10,440 | $542,600 | $252,500 | $290,100 |
| 2019 | $9,691 | $500,300 | $252,500 | $247,800 |
| 2018 | $9,122 | $470,700 | $252,500 | $218,200 |
| 2017 | $8,972 | $470,700 | $252,500 | $218,200 |
| 2016 | $8,421 | $437,900 | $252,500 | $185,400 |
| 2015 | $8,315 | $436,500 | $252,500 | $184,000 |
| 2014 | $8,482 | $436,100 | $252,500 | $183,600 |
Source: Public Records
Map
Nearby Homes
Your Personal Tour Guide
Ask me questions while you tour the home.