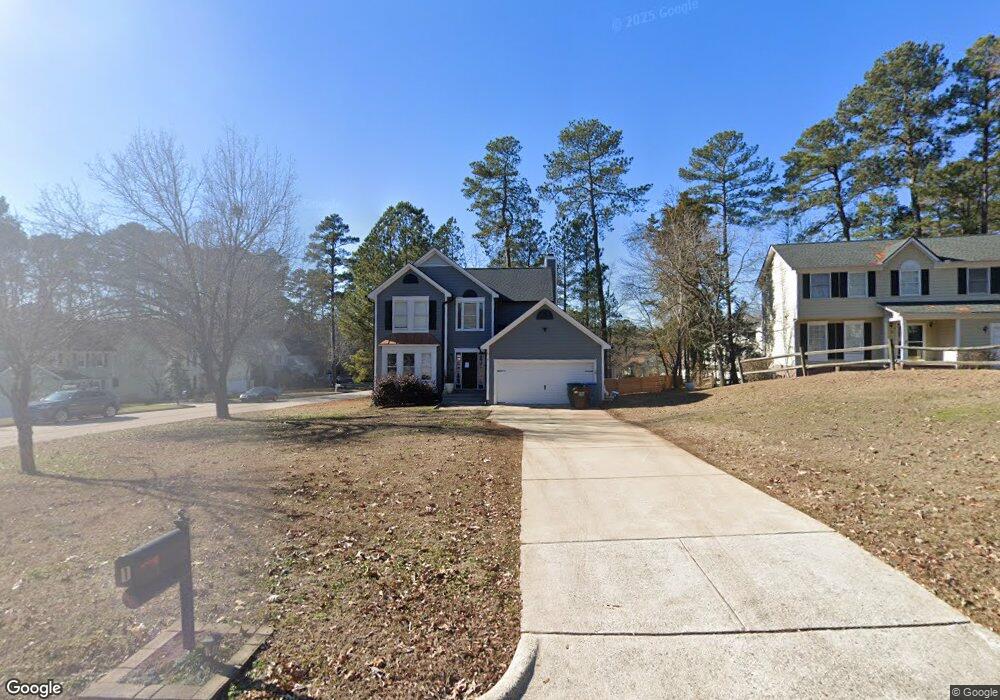
1 Huckleberry Ct Durham, NC 27713
South Durham NeighborhoodEstimated Value: $422,000 - $521,000
3
Beds
3
Baths
1,894
Sq Ft
$250/Sq Ft
Est. Value
About This Home
This home is located at 1 Huckleberry Ct, Durham, NC 27713 and is currently estimated at $472,700, approximately $249 per square foot. 1 Huckleberry Ct is a home located in Durham County with nearby schools including Lowe's Grove Middle, Hillside High School, and Kestrel Heights School.
Ownership History
Date
Name
Owned For
Owner Type
Purchase Details
Closed on
Jun 25, 2020
Sold by
Holmes John Alden and Holmes Christy Waugh
Bought by
Tattoli Blake
Current Estimated Value
Home Financials for this Owner
Home Financials are based on the most recent Mortgage that was taken out on this home.
Original Mortgage
$248,000
Outstanding Balance
$220,318
Interest Rate
3.2%
Mortgage Type
New Conventional
Estimated Equity
$252,382
Purchase Details
Closed on
Mar 29, 2018
Sold by
Torres Sergio De Jesus Serpas and Batres Anayanci E C
Bought by
Holmes John Alden and Holmes Cristy Waugh
Home Financials for this Owner
Home Financials are based on the most recent Mortgage that was taken out on this home.
Original Mortgage
$256,500
Interest Rate
4.38%
Mortgage Type
New Conventional
Purchase Details
Closed on
Sep 20, 2017
Sold by
Mcdunnah Brent Owen
Bought by
Torres Sergio De Jesus Serpas and Machuca Jose Roberto
Create a Home Valuation Report for This Property
The Home Valuation Report is an in-depth analysis detailing your home's value as well as a comparison with similar homes in the area
Home Values in the Area
Average Home Value in this Area
Purchase History
| Date | Buyer | Sale Price | Title Company |
|---|---|---|---|
| Tattoli Blake | $310,000 | None Available | |
| Holmes John Alden | $270,000 | None Available | |
| Torres Sergio De Jesus Serpas | $210,000 | None Available |
Source: Public Records
Mortgage History
| Date | Status | Borrower | Loan Amount |
|---|---|---|---|
| Open | Tattoli Blake | $248,000 | |
| Previous Owner | Holmes John Alden | $256,500 |
Source: Public Records
Tax History
| Year | Tax Paid | Tax Assessment Tax Assessment Total Assessment is a certain percentage of the fair market value that is determined by local assessors to be the total taxable value of land and additions on the property. | Land | Improvement |
|---|---|---|---|---|
| 2025 | $4,602 | $464,274 | $137,600 | $326,674 |
| 2024 | $3,725 | $267,050 | $57,465 | $209,585 |
| 2023 | $3,498 | $267,050 | $57,465 | $209,585 |
| 2022 | $3,418 | $267,050 | $57,465 | $209,585 |
| 2021 | $3,402 | $267,050 | $57,465 | $209,585 |
| 2020 | $3,322 | $267,050 | $57,465 | $209,585 |
| 2019 | $3,322 | $267,050 | $57,465 | $209,585 |
| 2018 | $2,974 | $219,216 | $38,310 | $180,906 |
| 2017 | $2,952 | $219,216 | $38,310 | $180,906 |
| 2016 | $2,852 | $219,216 | $38,310 | $180,906 |
| 2015 | $2,765 | $199,742 | $37,987 | $161,755 |
| 2014 | $2,765 | $199,742 | $37,987 | $161,755 |
Source: Public Records
Map
Nearby Homes
- 109 Settlers Mill Ln
- 111 Wenonah Way
- 43 Redbud Ct
- 7 Monteith Ct
- 7 Scenic Ct
- 124 Wicklow Ln
- 1 Haycox Ct
- 1304 Seaton Rd Unit 2
- 903 Limerick Ln
- 5504 Pelham Rd
- 4517 Grandale Dr
- 6353 Grandale Dr
- 1021 Pondfield Way
- 1621 Clermont Rd
- 1446 Clermont Rd
- 1509 Clermont Rd Unit T27
- 1509 Clermont Rd Unit T24
- 7 Travis Cir
- 4 Green Springs Ct
- 1215 Lotus Lilly Dr
- 3 Huckleberry Ct
- 108 Settlers Mill Ln
- 113 Settlers Mill Ln
- 110 Settlers Mill Ln
- 115 Settlers Mill Ln
- 104 Settlers Mill Ln
- 111 Settlers Mill Ln
- 117 Settlers Mill Ln
- 6 Huckleberry Ct
- 4 Huckleberry Ct
- 112 Settlers Mill Ln
- 119 Settlers Mill Ln
- 102 Settlers Mill Ln
- 1019 Park Glen Place
- 10 Colton Ct
- 107 Settlers Mill Ln
- 1017 Park Glen Place
- 100 Settlers Mill Ln
- 121 Settlers Mill Ln
- 114 Settlers Mill Ln
Your Personal Tour Guide
Ask me questions while you tour the home.