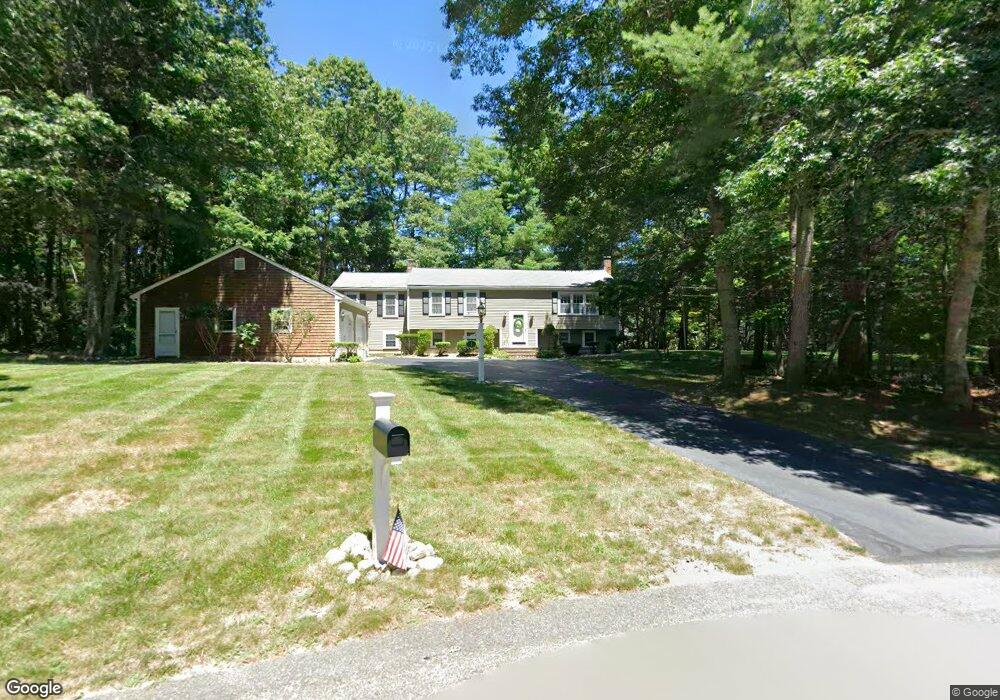
1 Hunt Farm Dr Duxbury, MA 02332
Estimated Value: $832,780 - $1,079,000
3
Beds
3
Baths
1,584
Sq Ft
$590/Sq Ft
Est. Value
About This Home
This home is located at 1 Hunt Farm Dr, Duxbury, MA 02332 and is currently estimated at $934,945, approximately $590 per square foot. 1 Hunt Farm Dr is a home located in Plymouth County with nearby schools including Chandler Elementary School, Alden School, and Duxbury Middle School.
Ownership History
Date
Name
Owned For
Owner Type
Purchase Details
Closed on
Feb 14, 2023
Sold by
Dobbins Richard J and Dobbins Mary E
Bought by
R J & Mary E Dobbins Ret
Current Estimated Value
Purchase Details
Closed on
Nov 7, 1990
Sold by
Assos R and Assos K
Bought by
Dobbins Richard J
Purchase Details
Closed on
Nov 5, 1990
Sold by
R & K Asso
Bought by
Dobbins Richard J
Create a Home Valuation Report for This Property
The Home Valuation Report is an in-depth analysis detailing your home's value as well as a comparison with similar homes in the area
Home Values in the Area
Average Home Value in this Area
Purchase History
| Date | Buyer | Sale Price | Title Company |
|---|---|---|---|
| R J & Mary E Dobbins Ret | -- | None Available | |
| Dobbins Richard J | $161,500 | -- | |
| Dobbins Richard J | $161,500 | -- |
Source: Public Records
Mortgage History
| Date | Status | Borrower | Loan Amount |
|---|---|---|---|
| Previous Owner | Dobbins Richard J | $460,000 | |
| Previous Owner | Dobbins Richard J | $90,000 |
Source: Public Records
Tax History Compared to Growth
Tax History
| Year | Tax Paid | Tax Assessment Tax Assessment Total Assessment is a certain percentage of the fair market value that is determined by local assessors to be the total taxable value of land and additions on the property. | Land | Improvement |
|---|---|---|---|---|
| 2025 | $7,634 | $752,900 | $332,500 | $420,400 |
| 2024 | $6,729 | $668,900 | $332,500 | $336,400 |
| 2023 | $7,125 | $666,500 | $345,800 | $320,700 |
| 2022 | $7,220 | $562,300 | $285,000 | $277,300 |
| 2021 | $7,000 | $483,400 | $237,500 | $245,900 |
| 2020 | $7,053 | $481,100 | $239,400 | $241,700 |
| 2019 | $6,602 | $449,700 | $199,500 | $250,200 |
| 2018 | $6,445 | $425,100 | $185,400 | $239,700 |
| 2017 | $6,119 | $394,500 | $173,300 | $221,200 |
| 2016 | $6,134 | $394,500 | $173,300 | $221,200 |
| 2015 | $7,271 | $466,100 | $237,500 | $228,600 |
Source: Public Records
Map
Nearby Homes
- 387 North St
- 286 North St
- 61 North St
- 31 Hillcrest Dr
- 66 Hemlock Dr
- 20 Amado Way
- 11 Hayloft Ln Unit 11
- 19 Hayloft Ln
- 2 Proprietors Dr Unit 23
- 30 Congress St
- 451 School St Unit 10-2
- 451 School St Unit 5-2
- 5 Royal Dane Dr Unit 46
- 89 Sunset Way
- 10 Royal Dane Dr Unit 88
- 17 Sherman Way
- 192 Taylor St
- 15 Bagnell Dr Unit 15
- 2104 Ocean St
- 487 Main St