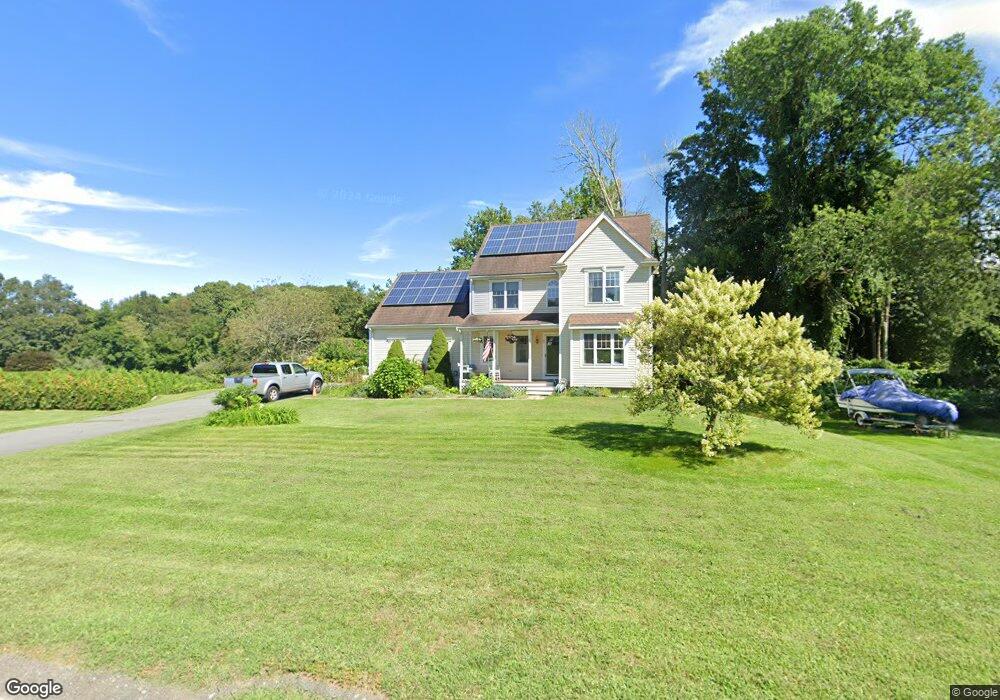
1 Hunters Way Westport, MA 02790
Booth/Handy Four Corners NeighborhoodEstimated Value: $683,000 - $717,000
3
Beds
--
Bath
2,004
Sq Ft
$350/Sq Ft
Est. Value
About This Home
This home is located at 1 Hunters Way, Westport, MA 02790 and is currently estimated at $700,653, approximately $349 per square foot. 1 Hunters Way is a home located in Bristol County with nearby schools including Alice A. Macomber Primary School, Westport Elementary School, and Westport Middle-High School.
Ownership History
Date
Name
Owned For
Owner Type
Purchase Details
Closed on
Oct 19, 2000
Sold by
Deer Run Land T and Sylvia Scott E
Bought by
Corey William and Corey Claudine A E
Current Estimated Value
Home Financials for this Owner
Home Financials are based on the most recent Mortgage that was taken out on this home.
Original Mortgage
$188,600
Interest Rate
7.88%
Mortgage Type
Purchase Money Mortgage
Create a Home Valuation Report for This Property
The Home Valuation Report is an in-depth analysis detailing your home's value as well as a comparison with similar homes in the area
Home Values in the Area
Average Home Value in this Area
Purchase History
| Date | Buyer | Sale Price | Title Company |
|---|---|---|---|
| Corey William | $65,000 | -- |
Source: Public Records
Mortgage History
| Date | Status | Borrower | Loan Amount |
|---|---|---|---|
| Open | Corey William | $217,000 | |
| Closed | Corey William | $188,600 |
Source: Public Records
Tax History Compared to Growth
Tax History
| Year | Tax Paid | Tax Assessment Tax Assessment Total Assessment is a certain percentage of the fair market value that is determined by local assessors to be the total taxable value of land and additions on the property. | Land | Improvement |
|---|---|---|---|---|
| 2025 | $4,036 | $541,800 | $203,300 | $338,500 |
| 2024 | $4,013 | $519,200 | $188,400 | $330,800 |
| 2023 | $3,848 | $471,600 | $158,700 | $312,900 |
| 2022 | $3,582 | $435,700 | $158,700 | $277,000 |
| 2021 | $110 | $415,600 | $144,400 | $271,200 |
| 2020 | $105 | $403,800 | $132,600 | $271,200 |
| 2019 | $99 | $368,800 | $120,600 | $248,200 |
| 2018 | $3,018 | $369,400 | $125,600 | $243,800 |
| 2017 | $2,966 | $372,100 | $125,600 | $246,500 |
| 2016 | $2,729 | $345,000 | $125,600 | $219,400 |
| 2015 | $2,687 | $338,900 | $125,600 | $213,300 |
Source: Public Records
Map
Nearby Homes
- 7 Village Way
- 8 Village Way
- 15 Village Way
- 837 Main Rd
- 8 Strawberry Ln
- 118 Charlotte White Rd Extension
- 0 Hidden Glen Ln
- 920 Drift Rd
- 101 Adamsville Rd
- 225 Hixbridge Rd
- 118 Charlotte White Rd
- Lot 0 Marcotte
- 978 Sodom Rd
- 47 Fallon Dr
- 73 White Oak Run
- 4 Main Rd
- 1346 Main Rd Unit B
- 6 Angel Ct
- 99 Sylvia Ln
- 308 Robert St