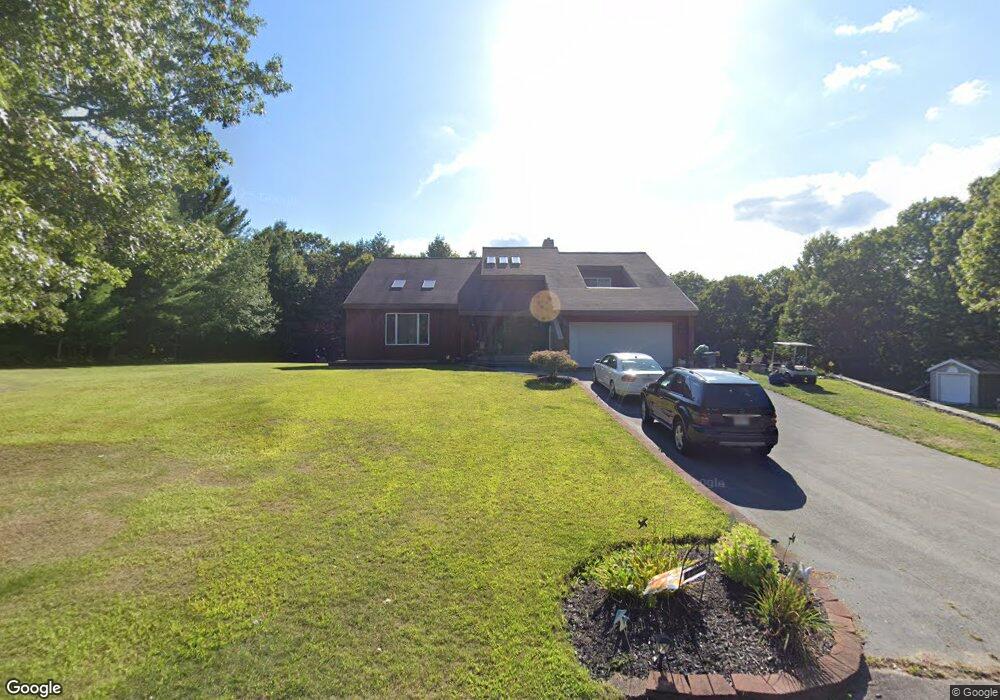
1 Inacio Ln Assonet, MA 02702
Estimated Value: $619,000 - $697,000
Studio
3
Baths
2,388
Sq Ft
$274/Sq Ft
Est. Value
About This Home
This home is located at 1 Inacio Ln, Assonet, MA 02702 and is currently estimated at $654,923, approximately $274 per square foot. 1 Inacio Ln is a home located in Bristol County with nearby schools including Freetown Elementary School, George R Austin Intermediate School, and Freetown-Lakeville Middle School.
Ownership History
Date
Name
Owned For
Owner Type
Purchase Details
Closed on
Jul 12, 1991
Sold by
Pettey Robert J and Pettey David F
Bought by
Inacio Manuel Joseph
Current Estimated Value
Home Financials for this Owner
Home Financials are based on the most recent Mortgage that was taken out on this home.
Original Mortgage
$41,000
Interest Rate
9.35%
Mortgage Type
Purchase Money Mortgage
Create a Home Valuation Report for This Property
The Home Valuation Report is an in-depth analysis detailing your home's value as well as a comparison with similar homes in the area
Purchase History
| Date | Buyer | Sale Price | Title Company |
|---|---|---|---|
| Inacio Manuel Joseph | $55,000 | -- |
Source: Public Records
Mortgage History
| Date | Status | Borrower | Loan Amount |
|---|---|---|---|
| Open | Inacio Manuel Joseph | $298,900 | |
| Closed | Inacio Manuel Joseph | $110,500 | |
| Closed | Inacio Manuel Joseph | $41,000 |
Source: Public Records
Tax History
| Year | Tax Paid | Tax Assessment Tax Assessment Total Assessment is a certain percentage of the fair market value that is determined by local assessors to be the total taxable value of land and additions on the property. | Land | Improvement |
|---|---|---|---|---|
| 2025 | $6,108 | $616,300 | $190,800 | $425,500 |
| 2024 | $5,965 | $571,900 | $180,000 | $391,900 |
| 2023 | $5,650 | $527,500 | $162,100 | $365,400 |
| 2022 | $5,398 | $447,600 | $137,300 | $310,300 |
| 2021 | $5,243 | $412,800 | $124,900 | $287,900 |
| 2020 | $5,208 | $400,000 | $120,100 | $279,900 |
| 2019 | $4,938 | $375,500 | $114,400 | $261,100 |
| 2018 | $4,673 | $351,100 | $114,400 | $236,700 |
| 2017 | $4,531 | $340,200 | $114,400 | $225,800 |
| 2016 | $4,236 | $323,600 | $111,100 | $212,500 |
| 2015 | $4,155 | $322,100 | $111,100 | $211,000 |
| 2014 | $4,011 | $318,100 | $108,800 | $209,300 |
Source: Public Records
Map
Nearby Homes
- 24 Bells Brook Rd
- 71 County St
- 145 County St
- 0 Sammys Ln
- 37 Simpson Ln
- 0 Chace Rd Unit 73481572
- 1 Freetown St
- 92 Chace Rd
- 5 Hadley Heights Way
- 16 Water St Unit C
- 16 Water St Unit A
- 16 Water St Unit B
- 16 Water St Unit D
- 42 High St
- 23 Elmwood Dr
- 00 Island Rd
- 14 Spruce Rd
- 23 5th Ave
- 73 Seymour St
- 0 Anthony St
Your Personal Tour Guide
Ask me questions while you tour the home.