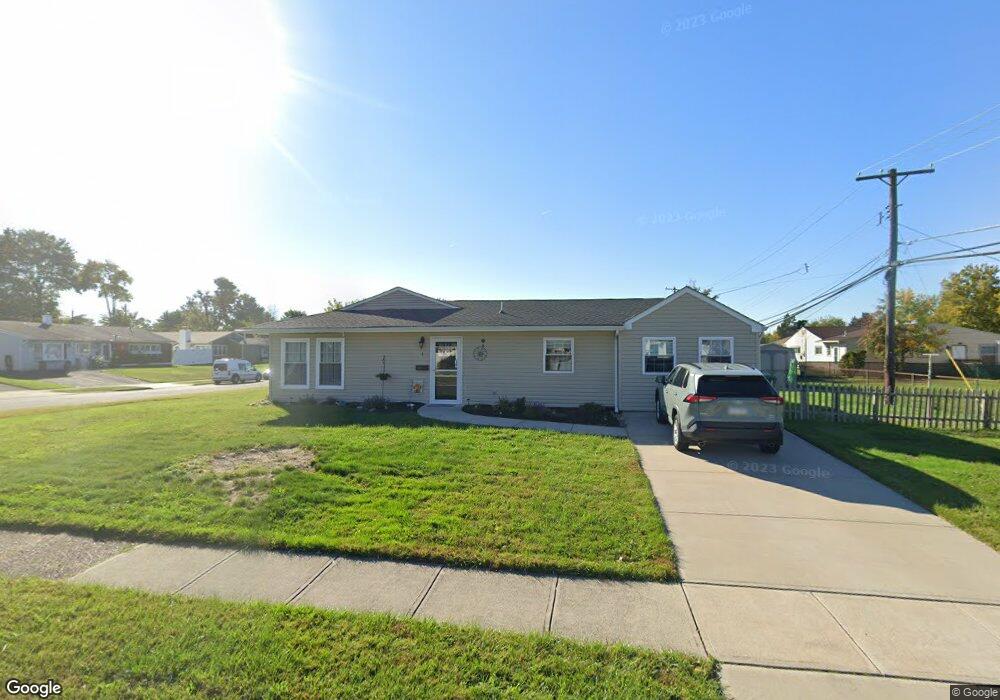
1 Indian Park Turn Levittown, PA 19057
Indian Creek NeighborhoodEstimated Value: $379,000 - $383,882
4
Beds
3
Baths
1,588
Sq Ft
$240/Sq Ft
Est. Value
About This Home
This home is located at 1 Indian Park Turn, Levittown, PA 19057 and is currently estimated at $381,721, approximately $240 per square foot. 1 Indian Park Turn is a home located in Bucks County with nearby schools including Truman Senior High School, First Presbyterian Church School, and Emilie Christian Day School.
Ownership History
Date
Name
Owned For
Owner Type
Purchase Details
Closed on
Jan 26, 2017
Sold by
Ferraro Mark and Ferraro Cindy
Bought by
Ferraro Cynthia and Ferraro Mark
Current Estimated Value
Home Financials for this Owner
Home Financials are based on the most recent Mortgage that was taken out on this home.
Original Mortgage
$194,797
Outstanding Balance
$160,921
Interest Rate
4.12%
Mortgage Type
FHA
Estimated Equity
$220,800
Purchase Details
Closed on
Jul 31, 2015
Sold by
Callaghan Services Llc
Bought by
Ferraro Mark and Ferraro Cindy
Home Financials for this Owner
Home Financials are based on the most recent Mortgage that was taken out on this home.
Original Mortgage
$195,054
Interest Rate
5.12%
Mortgage Type
FHA
Purchase Details
Closed on
Oct 10, 2014
Sold by
Acsay Andrew G
Bought by
Callaghan Services Llc
Purchase Details
Closed on
May 30, 1973
Bought by
Acsay Andrew G
Create a Home Valuation Report for This Property
The Home Valuation Report is an in-depth analysis detailing your home's value as well as a comparison with similar homes in the area
Home Values in the Area
Average Home Value in this Area
Purchase History
| Date | Buyer | Sale Price | Title Company |
|---|---|---|---|
| Ferraro Cynthia | -- | None Available | |
| Ferraro Mark | $215,400 | None Available | |
| Callaghan Services Llc | $76,000 | None Available | |
| Acsay Andrew G | -- | -- |
Source: Public Records
Mortgage History
| Date | Status | Borrower | Loan Amount |
|---|---|---|---|
| Open | Ferraro Cynthia | $194,797 | |
| Closed | Ferraro Mark | $195,054 |
Source: Public Records
Tax History Compared to Growth
Tax History
| Year | Tax Paid | Tax Assessment Tax Assessment Total Assessment is a certain percentage of the fair market value that is determined by local assessors to be the total taxable value of land and additions on the property. | Land | Improvement |
|---|---|---|---|---|
| 2025 | $5,393 | $19,860 | $4,720 | $15,140 |
| 2024 | $5,393 | $19,860 | $4,720 | $15,140 |
| 2023 | $5,354 | $19,860 | $4,720 | $15,140 |
| 2022 | $5,354 | $19,860 | $4,720 | $15,140 |
| 2021 | $5,354 | $19,860 | $4,720 | $15,140 |
| 2020 | $5,354 | $19,860 | $4,720 | $15,140 |
| 2019 | $5,334 | $19,860 | $4,720 | $15,140 |
| 2018 | $5,248 | $19,860 | $4,720 | $15,140 |
| 2017 | $5,168 | $19,860 | $4,720 | $15,140 |
| 2016 | $3,950 | $19,860 | $4,720 | $15,140 |
| 2015 | $3,036 | $16,400 | $4,720 | $11,680 |
| 2014 | $3,036 | $16,400 | $4,720 | $11,680 |
Source: Public Records
Map
Nearby Homes
- 101 Idlewild Rd
- 62 Indian Creek Dr
- 212 Plumbridge Dr
- 35 Inland Rd
- 50 Micahill Rd
- 26 Queen Lily Rd
- 86 Wildflower Rd
- 35 Parkside Cir
- 84 Whitewood Dr
- 7 Canal Rd
- 1019 Green Ln
- 94 Juniper Dr
- 154 Juniper Dr
- 58 Queen Lily Rd
- 57 Middle Rd
- 331 Indian Creek Dr
- 57 Island Rd
- 14 Iris Rd
- 23 Misty Pine Rd
- 16 Iris Rd
- 1 Indian Park Turn
- 57 Indian Park Rd
- 2 Indian Park Turn
- 130 Indian Creek Dr
- 53 Indian Park Rd
- 2 Indian Park Turn
- 64 Indian Park Rd
- 58 Indian Park Rd
- 6 Indian Park Rd
- 66 Indian Park Rd
- 6 Indian Park Turn
- 128 Indian Creek Dr
- 51 Indian Park Rd
- 70 Indian Park Rd
- 54 Indian Park Rd
- 73 Indian Park Rd
- 2 Inwood Rd
- 93 Idlewild Rd
- 148 Indian Creek Dr
- 1 Inwood Rd