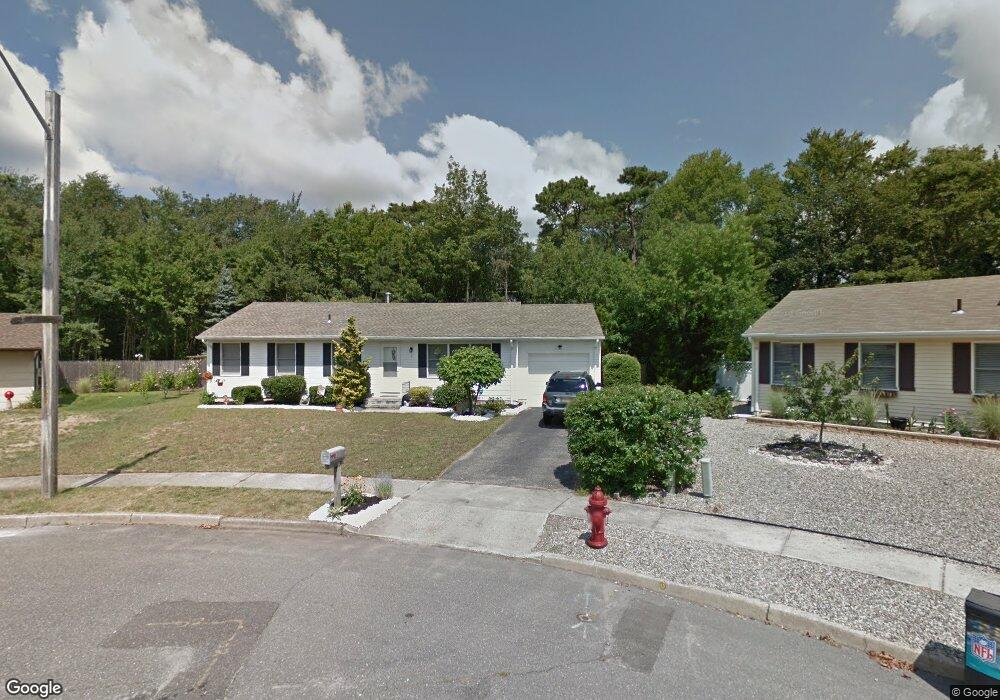
1 Iselin Ct Barnegat, NJ 08005
Barnegat Township NeighborhoodEstimated Value: $381,301 - $444,000
2
Beds
1
Bath
1,200
Sq Ft
$337/Sq Ft
Est. Value
About This Home
This home is located at 1 Iselin Ct, Barnegat, NJ 08005 and is currently estimated at $404,825, approximately $337 per square foot. 1 Iselin Ct is a home located in Ocean County with nearby schools including Barnegat High School.
Ownership History
Date
Name
Owned For
Owner Type
Purchase Details
Closed on
Feb 19, 2020
Sold by
Mahr Joel Q and Mahr Diane S
Bought by
Savino Marco and Savino Linda Ann
Current Estimated Value
Home Financials for this Owner
Home Financials are based on the most recent Mortgage that was taken out on this home.
Original Mortgage
$179,193
Outstanding Balance
$157,587
Interest Rate
3.25%
Mortgage Type
FHA
Estimated Equity
$247,238
Purchase Details
Closed on
Aug 2, 1997
Sold by
Deluise Doris
Bought by
Mahr Joel and Mahr Diane
Home Financials for this Owner
Home Financials are based on the most recent Mortgage that was taken out on this home.
Original Mortgage
$42,000
Interest Rate
7.56%
Create a Home Valuation Report for This Property
The Home Valuation Report is an in-depth analysis detailing your home's value as well as a comparison with similar homes in the area
Home Values in the Area
Average Home Value in this Area
Purchase History
| Date | Buyer | Sale Price | Title Company |
|---|---|---|---|
| Savino Marco | $182,500 | Surety Ttl Agcy Coastal Regi | |
| Mahr Joel | $65,000 | -- |
Source: Public Records
Mortgage History
| Date | Status | Borrower | Loan Amount |
|---|---|---|---|
| Open | Savino Marco | $179,193 | |
| Previous Owner | Mahr Joel | $42,000 |
Source: Public Records
Tax History Compared to Growth
Tax History
| Year | Tax Paid | Tax Assessment Tax Assessment Total Assessment is a certain percentage of the fair market value that is determined by local assessors to be the total taxable value of land and additions on the property. | Land | Improvement |
|---|---|---|---|---|
| 2025 | $5,409 | $181,700 | $102,000 | $79,700 |
| 2024 | $5,289 | $181,700 | $102,000 | $79,700 |
| 2023 | $5,118 | $181,700 | $102,000 | $79,700 |
| 2022 | $5,118 | $181,700 | $102,000 | $79,700 |
| 2021 | $5,067 | $181,700 | $102,000 | $79,700 |
| 2020 | $5,015 | $179,700 | $102,000 | $77,700 |
| 2019 | $4,942 | $179,700 | $102,000 | $77,700 |
| 2018 | $4,904 | $179,700 | $102,000 | $77,700 |
| 2017 | $4,823 | $179,700 | $102,000 | $77,700 |
| 2016 | $4,724 | $179,700 | $102,000 | $77,700 |
| 2015 | $4,575 | $179,700 | $102,000 | $77,700 |
| 2014 | $4,458 | $179,700 | $102,000 | $77,700 |
Source: Public Records
Map
Nearby Homes