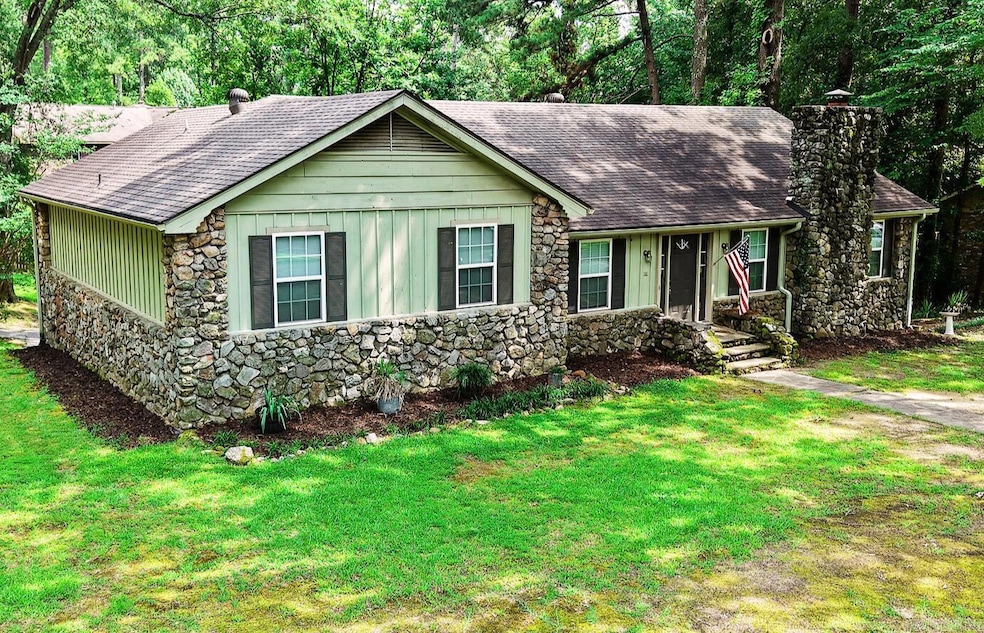
1 Ivy Cir Arkadelphia, AR 71923
Estimated payment $2,192/month
Highlights
- Deck
- Wood Flooring
- Corner Lot
- 2-Story Property
- Bonus Room
- Home Office
About This Home
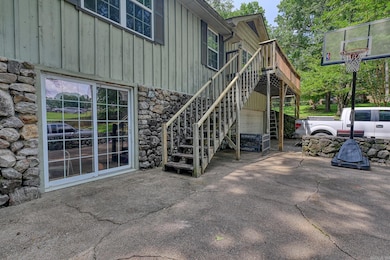
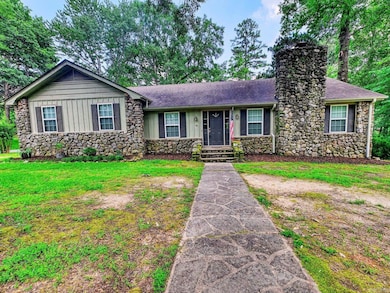
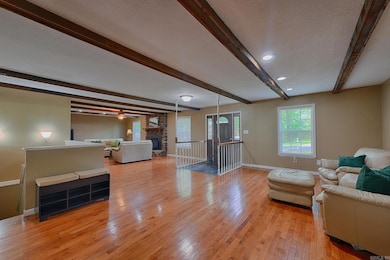
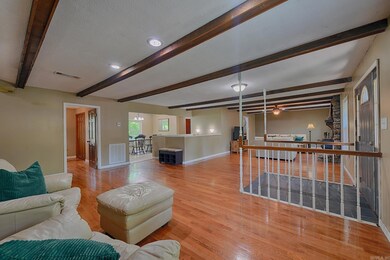
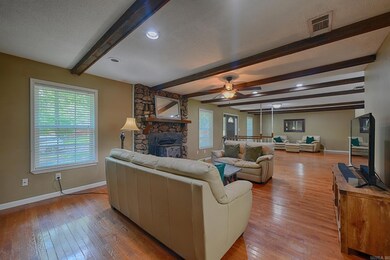
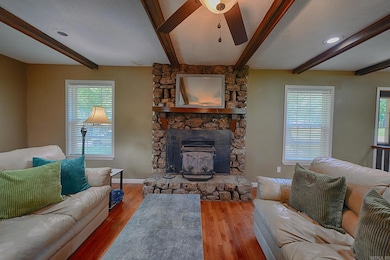
***Updated 3560sf home situated on a beautiful one-acre corner lot in a highly desired, established neighborhood*** Upstairs offers 2,248 SF with 4 bedrooms and 2.5 baths. The spacious kitchen features custom floor-to-ceiling cabinetry with built in features and opens to a tiled dining area, laundry room and half bath. Living room boasts a wood burning stove with a gorgeous rock fireplace perfect for the holidays. Hardwood floors flow through the main living space, hallway and first bedroom. The primary suite includes a private deck overlooking the wooded yard and terrace below. Downstairs, the walk-out basement adds 1,312 SF with a large living area, 2 bedrooms, and a full bath—ideal for a second kitchen, multigenerational living, or rental income. The 2-car garage has abundant storage with shelving and 2 large storage rooms. Exterior showcases natural rock and painted wood siding that blends with the surrounding mature trees. Architectural shingle roof, full gutters with French drains, newer windows, 2 HVAC units and thoughtful updates throughout make this home truly move-in ready.
Home Details
Home Type
- Single Family
Est. Annual Taxes
- $2,322
Year Built
- Built in 1979
Lot Details
- 0.59 Acre Lot
- Partially Fenced Property
- Wood Fence
- Landscaped
- Corner Lot
- Level Lot
Parking
- 2 Car Garage
Home Design
- 2-Story Property
- Traditional Architecture
- Split Level Home
- Combination Foundation
- Rock and Frame
- Architectural Shingle Roof
- Ridge Vents on the Roof
- Wood Siding
- Stone Exterior Construction
Interior Spaces
- 3,560 Sq Ft Home
- Paneling
- Sheet Rock Walls or Ceilings
- Ceiling Fan
- Wood Burning Fireplace
- Insulated Windows
- Window Treatments
- Family Room
- Formal Dining Room
- Home Office
- Bonus Room
- Game Room
- Fire and Smoke Detector
Kitchen
- Electric Range
- Stove
- Dishwasher
- Disposal
Flooring
- Wood
- Carpet
- Concrete
- Tile
Bedrooms and Bathrooms
- 6 Bedrooms
- Walk-in Shower
Laundry
- Laundry Room
- Washer and Electric Dryer Hookup
Finished Basement
- Heated Basement
- Walk-Out Basement
Outdoor Features
- Deck
- Porch
Utilities
- Central Heating and Cooling System
- Gas Water Heater
Listing and Financial Details
- Assessor Parcel Number 74-02137-000
Map
Home Values in the Area
Average Home Value in this Area
Tax History
| Year | Tax Paid | Tax Assessment Tax Assessment Total Assessment is a certain percentage of the fair market value that is determined by local assessors to be the total taxable value of land and additions on the property. | Land | Improvement |
|---|---|---|---|---|
| 2024 | $1,722 | $39,150 | $3,200 | $35,950 |
| 2023 | $1,797 | $39,150 | $3,200 | $35,950 |
| 2022 | $1,847 | $39,150 | $3,200 | $35,950 |
| 2021 | $1,847 | $39,150 | $3,200 | $35,950 |
| 2020 | $1,791 | $39,150 | $3,200 | $35,950 |
| 2019 | $1,688 | $36,350 | $3,200 | $33,150 |
| 2018 | $1,695 | $36,350 | $3,200 | $33,150 |
| 2017 | $1,695 | $36,350 | $3,200 | $33,150 |
| 2016 | $1,695 | $36,350 | $3,200 | $33,150 |
| 2015 | $1,676 | $36,350 | $3,200 | $33,150 |
| 2014 | -- | $34,300 | $3,200 | $31,100 |
Property History
| Date | Event | Price | List to Sale | Price per Sq Ft |
|---|---|---|---|---|
| 09/25/2025 09/25/25 | For Sale | $379,000 | -- | $106 / Sq Ft |
Purchase History
| Date | Type | Sale Price | Title Company |
|---|---|---|---|
| Special Warranty Deed | $118,000 | -- | |
| Warranty Deed | -- | -- | |
| Warranty Deed | $185,000 | -- | |
| Warranty Deed | $118,000 | -- | |
| Deed | -- | -- |
Mortgage History
| Date | Status | Loan Amount | Loan Type |
|---|---|---|---|
| Closed | $100,300 | No Value Available | |
| Previous Owner | $211,961 | No Value Available |
Source: Cooperative Arkansas REALTORS® MLS
MLS Number: 25038584
APN: 74-02137-000
Disclaimer: Certain information contained herein is derived from information provided by parties other than Homes.com. All information provided is deemed reliable, but is not guaranteed to be accurate and should be independently verified.
![]() IDX information is provided exclusively for personal, non-commercial use, and may not be used for any purpose other than to identify prospective properties consumers may be interested in purchasing.
IDX information is provided exclusively for personal, non-commercial use, and may not be used for any purpose other than to identify prospective properties consumers may be interested in purchasing.
- 10 Ivy Cir
- 4 Ivy Cir
- 5 Montclair Cir
- Lot 129 N 26th St
- 2401 Forrest Park Dr
- 1004 N 26th St
- 807 N Park Dr
- TBD N Park Dr
- 2204 Northridge Dr
- 7 Timber Ridge Cir
- 213 N Park Dr
- 4 Ashbury Ct
- 309 N 26th St
- 288 Shepherd Loop Dr
- 234 N 26th St Unit 235 N 25th St
- 289 Shepherd Loop Dr
- 51 Gorman Loop
- 1704 Northridge Dr
- 101 Shepherd Loop Dr
- xxx Cypress Rd
- 329 Amity Rd
- 5371 Central Ave Unit 6B
- 5371 Central Ave
- 113 Shadow Peak Ln Unit B
- 200 Hamilton Oaks Dr
- 200 Hamilton Oaks Dr Unit J3
- 200 Hamilton Oaks Dr
- 136 Catalina Cir
- 250 Grand Isle Dr Unit 2F
- 250 Grand Isle Dr Unit 3E
- 779 Old Brundage Rd
- 202 Little John Trail
- 451 Lakeland Dr
- 389 Lake Hamilton Dr
- 200 Lakeland Dr
- 2190 Higdon Ferry Rd
- 407 E Sullenberger Ave
- 1203 Marion Anderson Rd
- 895 Marion Anderson Rd
- 102 Calli St
