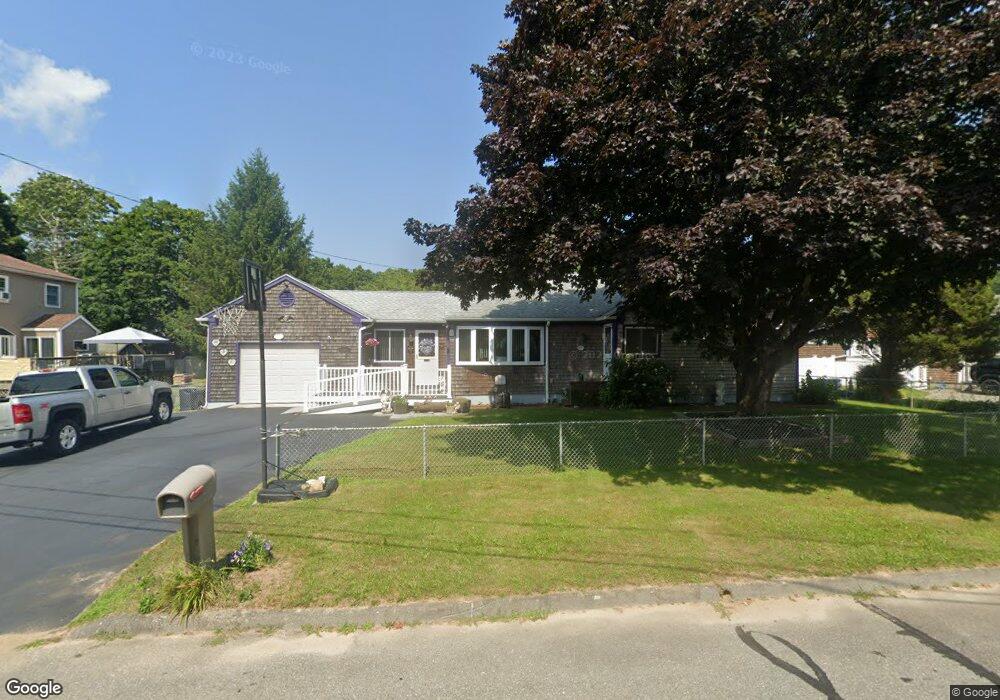
1 John St Fairhaven, MA 02719
Pope Beach NeighborhoodEstimated Value: $453,000 - $585,000
2
Beds
1
Bath
1,260
Sq Ft
$392/Sq Ft
Est. Value
About This Home
This home is located at 1 John St, Fairhaven, MA 02719 and is currently estimated at $493,705, approximately $391 per square foot. 1 John St is a home located in Bristol County with nearby schools including Fairhaven High School, City On A Hill Charter Public School New Bedford, and St. Joseph School.
Ownership History
Date
Name
Owned For
Owner Type
Purchase Details
Closed on
Jul 14, 2025
Sold by
Blum Debra M
Bought by
Blum Debra M and Blum Jennifer A
Current Estimated Value
Purchase Details
Closed on
Mar 1, 2000
Sold by
Hoefel Raymond H
Bought by
Blum Stefan M and Blum Debra M
Home Financials for this Owner
Home Financials are based on the most recent Mortgage that was taken out on this home.
Original Mortgage
$94,900
Interest Rate
8.21%
Mortgage Type
Purchase Money Mortgage
Create a Home Valuation Report for This Property
The Home Valuation Report is an in-depth analysis detailing your home's value as well as a comparison with similar homes in the area
Home Values in the Area
Average Home Value in this Area
Purchase History
| Date | Buyer | Sale Price | Title Company |
|---|---|---|---|
| Blum Debra M | -- | -- | |
| Blum Debra M | -- | -- | |
| Blum Debra M | -- | -- | |
| Blum Stefan M | $129,900 | -- | |
| Blum Stefan M | $129,900 | -- |
Source: Public Records
Mortgage History
| Date | Status | Borrower | Loan Amount |
|---|---|---|---|
| Previous Owner | Blum Stefan M | $165,000 | |
| Previous Owner | Blum Stefan M | $145,000 | |
| Previous Owner | Blum Stefan M | $35,000 | |
| Previous Owner | Blum Stefan M | $94,900 |
Source: Public Records
Tax History
| Year | Tax Paid | Tax Assessment Tax Assessment Total Assessment is a certain percentage of the fair market value that is determined by local assessors to be the total taxable value of land and additions on the property. | Land | Improvement |
|---|---|---|---|---|
| 2025 | $3,593 | $385,500 | $175,400 | $210,100 |
| 2024 | $3,336 | $361,400 | $175,400 | $186,000 |
| 2023 | $3,198 | $321,400 | $153,700 | $167,700 |
| 2022 | $3,028 | $296,300 | $142,800 | $153,500 |
| 2021 | $2,876 | $254,700 | $129,200 | $125,500 |
| 2020 | $2,817 | $254,700 | $129,200 | $125,500 |
| 2019 | $2,684 | $230,000 | $107,200 | $122,800 |
| 2018 | $2,583 | $219,800 | $102,000 | $117,800 |
| 2017 | $2,587 | $214,900 | $102,000 | $112,900 |
| 2016 | $2,552 | $209,500 | $102,000 | $107,500 |
| 2015 | $2,516 | $207,100 | $102,000 | $105,100 |
Source: Public Records
Map
Nearby Homes
- 58 Bayview Ave
- 00 Copeland St
- 27 Bayview Ave
- 15 Bayview Ave
- 3.5 Golf St
- 00 Huttleston Ave
- 190 Sconticut Neck Rd
- 33 Narragansett Blvd
- 8 Manor Dr
- 181 Washington St
- 2 Washburn Ave
- 11 Lawton St
- 145 Pleasant St
- 77 Adams St
- 5 Reservation Rd
- 32 Cedar St
- 39 Christian St
- 58 Washington St
- 32 Green St
- 67 Bridge St
Your Personal Tour Guide
Ask me questions while you tour the home.