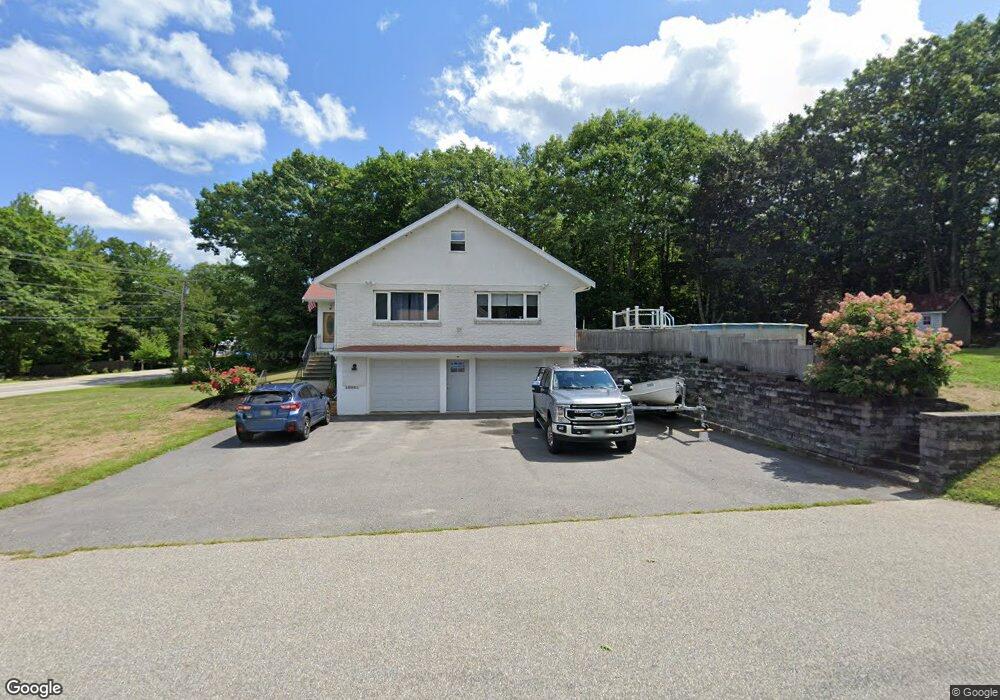
1 Keely Way Biddeford, ME 04005
South Biddeford NeighborhoodEstimated Value: $643,381 - $757,000
3
Beds
3
Baths
2,884
Sq Ft
$239/Sq Ft
Est. Value
About This Home
This home is located at 1 Keely Way, Biddeford, ME 04005 and is currently estimated at $689,845, approximately $239 per square foot. 1 Keely Way is a home located in York County with nearby schools including John F Kennedy Memorial School, Biddeford Primary School, and Biddeford Intermediate School.
Ownership History
Date
Name
Owned For
Owner Type
Purchase Details
Closed on
May 23, 2018
Sold by
Dale Ann M and Mailhtot Ann M
Bought by
Dale Ann M and Dale Matthew P
Current Estimated Value
Purchase Details
Closed on
Sep 20, 2012
Sold by
Keely Brian L
Bought by
Mailhtot Ann M and Keely Ann M
Create a Home Valuation Report for This Property
The Home Valuation Report is an in-depth analysis detailing your home's value as well as a comparison with similar homes in the area
Home Values in the Area
Average Home Value in this Area
Purchase History
| Date | Buyer | Sale Price | Title Company |
|---|---|---|---|
| Dale Ann M | -- | -- | |
| Dale Ann M | -- | -- | |
| Dale Ann M | -- | -- | |
| Mailhtot Ann M | -- | -- | |
| Mailhtot Ann M | -- | -- |
Source: Public Records
Tax History
| Year | Tax Paid | Tax Assessment Tax Assessment Total Assessment is a certain percentage of the fair market value that is determined by local assessors to be the total taxable value of land and additions on the property. | Land | Improvement |
|---|---|---|---|---|
| 2025 | $7,437 | $497,800 | $156,800 | $341,000 |
| 2024 | $7,047 | $495,600 | $156,800 | $338,800 |
| 2023 | $6,467 | $492,900 | $154,100 | $338,800 |
| 2022 | $6,917 | $421,500 | $104,100 | $317,400 |
| 2021 | $6,568 | $360,300 | $88,000 | $272,300 |
| 2020 | $6,574 | $327,900 | $76,800 | $251,100 |
| 2019 | $6,551 | $327,900 | $76,800 | $251,100 |
| 2018 | $6,460 | $327,900 | $76,800 | $251,100 |
| 2017 | $5,943 | $296,100 | $76,800 | $219,300 |
| 2016 | $5,881 | $296,100 | $76,800 | $219,300 |
| 2015 | $5,570 | $296,100 | $76,800 | $219,300 |
| 2014 | $5,433 | $296,100 | $76,800 | $219,300 |
| 2013 | -- | $304,100 | $68,200 | $235,900 |
Source: Public Records
Map
Nearby Homes
- 625 Pool St
- 650 Pool St
- 5 Twin Island Dr
- 26 Meeting House Rd
- 74 Guinea Rd
- 9 Windward Ridge
- 378 Pool St
- 4 Walker Dr Unit 101
- 3 Walker Dr Unit 101
- 3 Walker Dr Unit 101
- 353 Pool St
- TBD 530 Ferry Rd
- 295 Ferry Rd
- 18 Camp Ellis Ave
- 8 Rockwood Dr
- 1 Main Ave
- 10 Lower Beach Rd
- 9 Riverside Ave
- 30 Vines Rd
- 5 Red Oak Ln
Your Personal Tour Guide
Ask me questions while you tour the home.