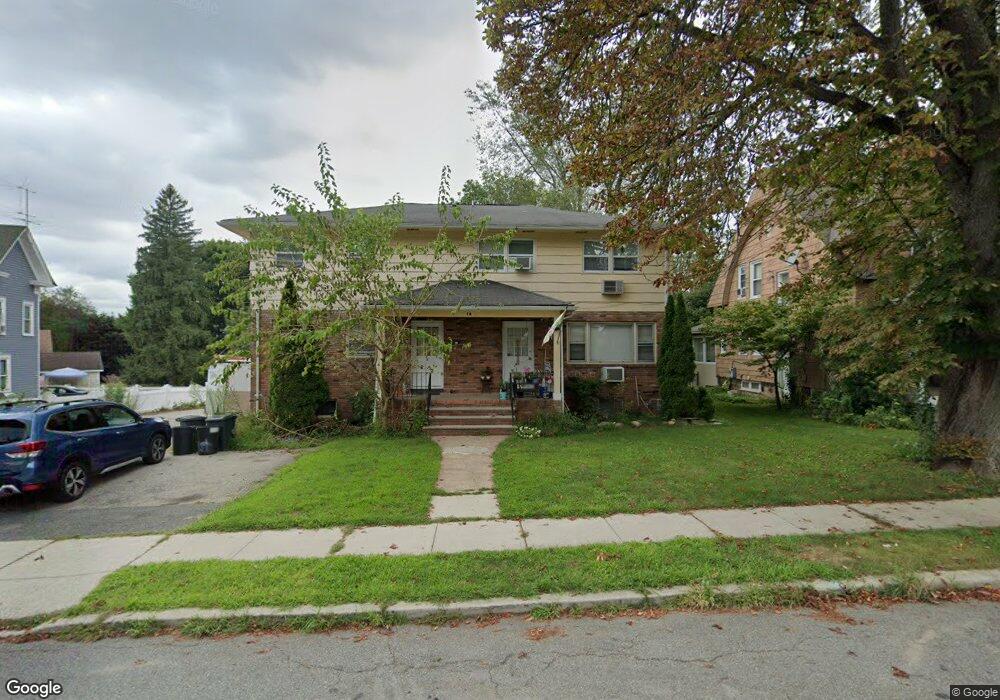
1 Kings Rd Unit 2 Netcong, NJ 07857
Estimated Value: $456,736 - $527,000
2
Beds
1
Bath
2,080
Sq Ft
$237/Sq Ft
Est. Value
About This Home
This home is located at 1 Kings Rd Unit 2, Netcong, NJ 07857 and is currently estimated at $493,934, approximately $237 per square foot. 1 Kings Rd Unit 2 is a home located in Morris County with nearby schools including Netcong Elementary School and Lenape Val Regional High School.
Ownership History
Date
Name
Owned For
Owner Type
Purchase Details
Closed on
Sep 9, 2016
Sold by
Leka Nijazi
Bought by
Pearl Equities Llc
Current Estimated Value
Purchase Details
Closed on
Oct 23, 2012
Sold by
Leka Rexhep
Bought by
Leka Nijazi
Purchase Details
Closed on
Sep 15, 2005
Sold by
Leka Nezir
Bought by
Leka Rexhep and Leka Nijazi
Home Financials for this Owner
Home Financials are based on the most recent Mortgage that was taken out on this home.
Original Mortgage
$229,000
Interest Rate
5.84%
Mortgage Type
New Conventional
Purchase Details
Closed on
Oct 31, 2002
Sold by
Joe Church
Bought by
Leka Niazi
Create a Home Valuation Report for This Property
The Home Valuation Report is an in-depth analysis detailing your home's value as well as a comparison with similar homes in the area
Home Values in the Area
Average Home Value in this Area
Purchase History
| Date | Buyer | Sale Price | Title Company |
|---|---|---|---|
| Pearl Equities Llc | $4,928 | None Available | |
| Leka Nijazi | -- | None Available | |
| Leka Rexhep | -- | -- | |
| Leka Niazi | $210,000 | -- |
Source: Public Records
Mortgage History
| Date | Status | Borrower | Loan Amount |
|---|---|---|---|
| Previous Owner | Leka Rexhep | $229,000 |
Source: Public Records
Tax History Compared to Growth
Tax History
| Year | Tax Paid | Tax Assessment Tax Assessment Total Assessment is a certain percentage of the fair market value that is determined by local assessors to be the total taxable value of land and additions on the property. | Land | Improvement |
|---|---|---|---|---|
| 2025 | $9,817 | $287,300 | $102,000 | $185,300 |
| 2024 | $9,903 | $287,300 | $102,000 | $185,300 |
| 2023 | $9,903 | $287,300 | $102,000 | $185,300 |
| 2022 | $8,972 | $287,300 | $102,000 | $185,300 |
| 2021 | $8,972 | $287,300 | $102,000 | $185,300 |
| 2020 | $10,400 | $338,100 | $144,500 | $193,600 |
| 2019 | $9,900 | $338,100 | $144,500 | $193,600 |
| 2018 | $9,308 | $338,100 | $144,500 | $193,600 |
| 2017 | $8,943 | $338,100 | $144,500 | $193,600 |
| 2016 | $8,699 | $338,100 | $144,500 | $193,600 |
| 2015 | $8,382 | $338,100 | $144,500 | $193,600 |
| 2014 | $8,016 | $338,100 | $144,500 | $193,600 |
Source: Public Records
Map
Nearby Homes