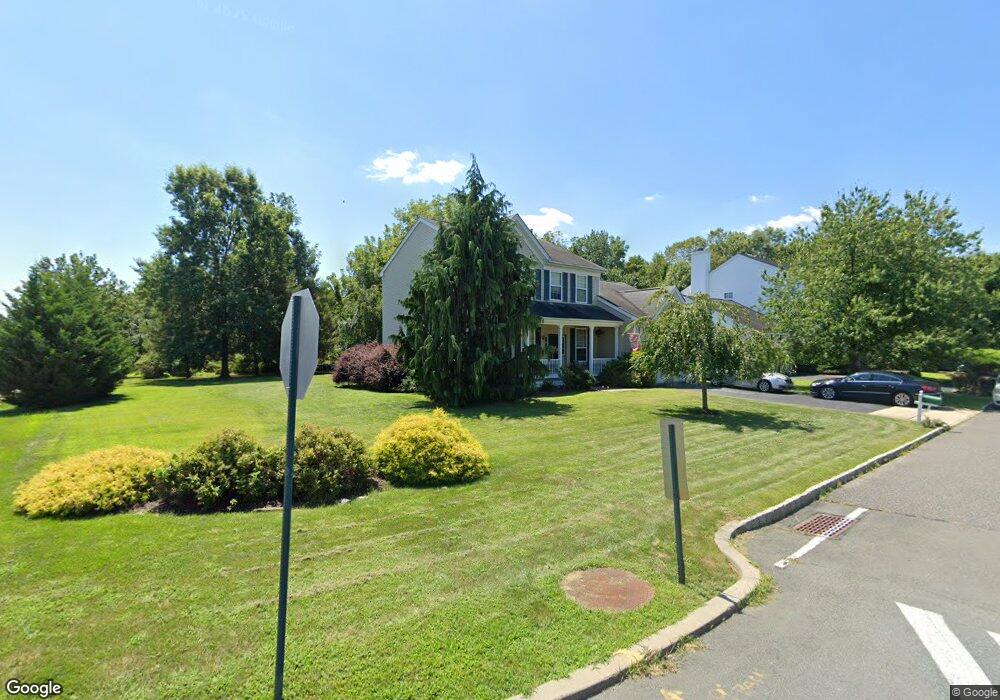
1 Larchmont Ct Pennington, NJ 08534
Estimated Value: $626,000 - $860,000
--
Bed
--
Bath
1,897
Sq Ft
$400/Sq Ft
Est. Value
About This Home
This home is located at 1 Larchmont Ct, Pennington, NJ 08534 and is currently estimated at $758,923, approximately $400 per square foot. 1 Larchmont Ct is a home located in Mercer County with nearby schools including Hopewell Valley Central High School, Guidepost Montessori at Lawrenceville, and Saint Ann School.
Ownership History
Date
Name
Owned For
Owner Type
Purchase Details
Closed on
Mar 27, 2002
Sold by
Moore Jeremiah
Bought by
Beyer Christopher and Beyer Corinne
Current Estimated Value
Home Financials for this Owner
Home Financials are based on the most recent Mortgage that was taken out on this home.
Original Mortgage
$292,800
Outstanding Balance
$121,726
Interest Rate
6.85%
Estimated Equity
$637,197
Purchase Details
Closed on
Jul 29, 1999
Sold by
Ferry Matthew
Bought by
Moore Jeremiah
Home Financials for this Owner
Home Financials are based on the most recent Mortgage that was taken out on this home.
Original Mortgage
$100,000
Interest Rate
7.85%
Purchase Details
Closed on
Oct 12, 1995
Sold by
Hopewell K Hovnanian
Bought by
Ferry Matthew and Ferry Daphnee
Home Financials for this Owner
Home Financials are based on the most recent Mortgage that was taken out on this home.
Original Mortgage
$167,000
Interest Rate
7.62%
Create a Home Valuation Report for This Property
The Home Valuation Report is an in-depth analysis detailing your home's value as well as a comparison with similar homes in the area
Home Values in the Area
Average Home Value in this Area
Purchase History
| Date | Buyer | Sale Price | Title Company |
|---|---|---|---|
| Beyer Christopher | $366,000 | -- | |
| Moore Jeremiah | $263,000 | -- | |
| Ferry Matthew | $209,314 | -- |
Source: Public Records
Mortgage History
| Date | Status | Borrower | Loan Amount |
|---|---|---|---|
| Open | Beyer Christopher | $292,800 | |
| Previous Owner | Moore Jeremiah | $100,000 | |
| Previous Owner | Ferry Matthew | $167,000 |
Source: Public Records
Tax History Compared to Growth
Tax History
| Year | Tax Paid | Tax Assessment Tax Assessment Total Assessment is a certain percentage of the fair market value that is determined by local assessors to be the total taxable value of land and additions on the property. | Land | Improvement |
|---|---|---|---|---|
| 2025 | $14,847 | $470,300 | $225,900 | $244,400 |
| 2024 | $13,868 | $470,300 | $225,900 | $244,400 |
| 2023 | $13,868 | $453,800 | $209,400 | $244,400 |
| 2022 | $13,582 | $453,800 | $209,400 | $244,400 |
| 2021 | $13,349 | $436,400 | $192,000 | $244,400 |
| 2020 | $13,027 | $436,400 | $192,000 | $244,400 |
| 2019 | $12,708 | $436,400 | $192,000 | $244,400 |
| 2018 | $12,472 | $436,400 | $192,000 | $244,400 |
| 2017 | $12,132 | $436,400 | $192,000 | $244,400 |
| 2016 | $11,469 | $436,400 | $192,000 | $244,400 |
| 2015 | $11,586 | $436,400 | $192,000 | $244,400 |
| 2014 | $11,346 | $436,400 | $192,000 | $244,400 |
Source: Public Records
Map
Nearby Homes
- 23 Navesink Dr
- 203 Castleton Ct
- 117 Treymore Ct
- 205 Gentry Ct
- 185 Spring Beauty Dr
- 614 Bollen Ct
- 199 Spring Beauty Dr
- 157 Coburn Rd
- 4 Larkspur Ln
- 74 Schindler Ct
- 6 Allura Ct
- 371 Watkins Rd
- 34 Schindler Ct Unit 17
- 34 Schindler Ct
- 4 Carey St
- 24 Karena Ln
- 52 Temple Ct
- 142 Traditions Way
- 16 Coburn Rd
- 25 Blake Dr