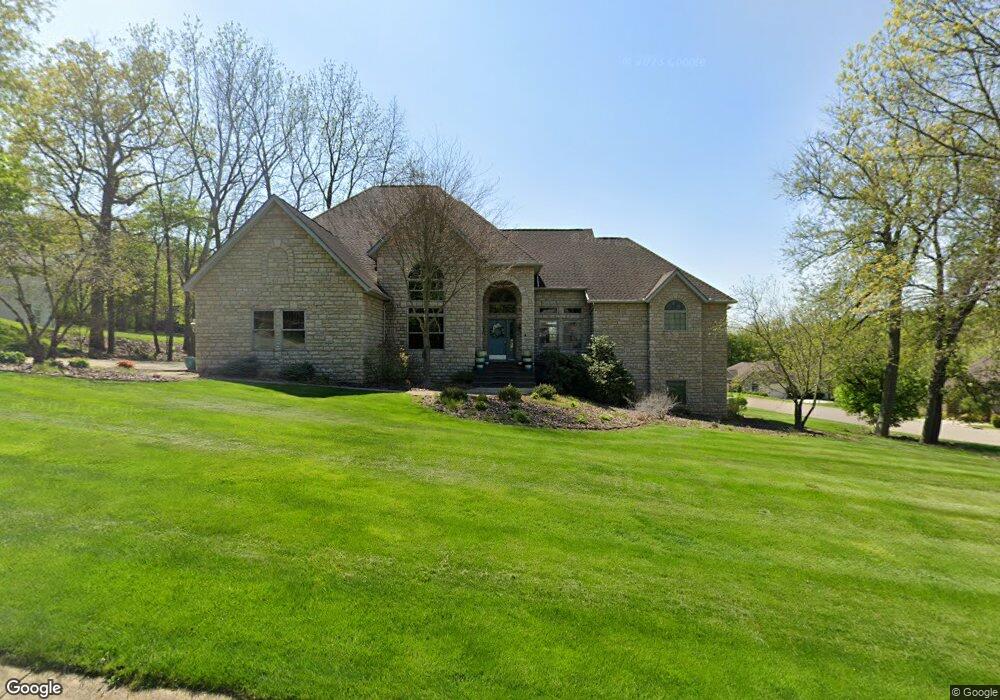
1 Laurel Hill Ct Mount Vernon, OH 43050
Estimated Value: $596,000 - $682,000
4
Beds
4
Baths
3,588
Sq Ft
$176/Sq Ft
Est. Value
About This Home
This home is located at 1 Laurel Hill Ct, Mount Vernon, OH 43050 and is currently estimated at $630,555, approximately $175 per square foot. 1 Laurel Hill Ct is a home located in Knox County with nearby schools including Mount Vernon High School, St. Vincent de Paul School, and Christian Star Academy.
Ownership History
Date
Name
Owned For
Owner Type
Purchase Details
Closed on
Apr 25, 2025
Sold by
Connell Edward N and Connell Linda C
Bought by
Bailey Clinton G and Bailey Kelly R
Current Estimated Value
Home Financials for this Owner
Home Financials are based on the most recent Mortgage that was taken out on this home.
Original Mortgage
$480,000
Outstanding Balance
$477,361
Interest Rate
6.5%
Mortgage Type
New Conventional
Estimated Equity
$153,194
Purchase Details
Closed on
Jun 7, 1999
Sold by
Campbell John E
Bought by
Connell Edward N and Connell Linda
Purchase Details
Closed on
Jan 23, 1997
Bought by
Campbell John E
Purchase Details
Closed on
Sep 27, 1995
Bought by
Z And B Trustees Inc An O
Purchase Details
Closed on
Sep 19, 1995
Bought by
Pennel Properties An Ohio
Create a Home Valuation Report for This Property
The Home Valuation Report is an in-depth analysis detailing your home's value as well as a comparison with similar homes in the area
Home Values in the Area
Average Home Value in this Area
Purchase History
| Date | Buyer | Sale Price | Title Company |
|---|---|---|---|
| Bailey Clinton G | $600,000 | None Listed On Document | |
| Connell Edward N | $300,000 | -- | |
| Campbell John E | $118,300 | -- | |
| Z And B Trustees Inc An O | -- | -- | |
| Pennel Properties An Ohio | -- | -- |
Source: Public Records
Mortgage History
| Date | Status | Borrower | Loan Amount |
|---|---|---|---|
| Open | Bailey Clinton G | $480,000 |
Source: Public Records
Tax History Compared to Growth
Tax History
| Year | Tax Paid | Tax Assessment Tax Assessment Total Assessment is a certain percentage of the fair market value that is determined by local assessors to be the total taxable value of land and additions on the property. | Land | Improvement |
|---|---|---|---|---|
| 2024 | $7,625 | $197,810 | $23,120 | $174,690 |
| 2023 | $7,625 | $197,810 | $23,120 | $174,690 |
| 2022 | $6,053 | $143,350 | $16,760 | $126,590 |
| 2021 | $6,064 | $143,350 | $16,760 | $126,590 |
| 2020 | $5,906 | $143,350 | $16,760 | $126,590 |
| 2019 | $5,590 | $126,450 | $15,630 | $110,820 |
| 2018 | $5,590 | $126,450 | $15,630 | $110,820 |
| 2017 | $5,490 | $126,450 | $15,630 | $110,820 |
| 2016 | $5,092 | $117,080 | $14,470 | $102,610 |
| 2015 | $5,114 | $117,080 | $14,470 | $102,610 |
| 2014 | $5,140 | $117,080 | $14,470 | $102,610 |
| 2013 | $5,371 | $116,770 | $13,600 | $103,170 |
Source: Public Records
Map
Nearby Homes
- 1432 Laurel Valley Dr
- 22 Laurel Valley Dr
- 10 Laurel Valley Dr
- 23 Laurel Valley Dr
- 11 Laurel Valley Dr
- 21 Laurel Valley Dr
- 0 Laurel Valley Dr Unit Lot 11 2827524
- 0 Laurel Valley Dr
- 3 Laurel Hill Ct
- 1442 Laurel Valley Dr
- 1435 Laurel Valley Dr
- 1439 Laurel Valley Dr
- 1431 Laurel Valley Dr
- 1428 Laurel Valley Dr
- 4 Laurel Hill Ct
- 1427 Laurel Valley Dr
- 1446 Laurel Valley Dr
- 21 Laurelwood Dr
- 1450 Laurel Valley Dr
- 17 Laurelwood Dr