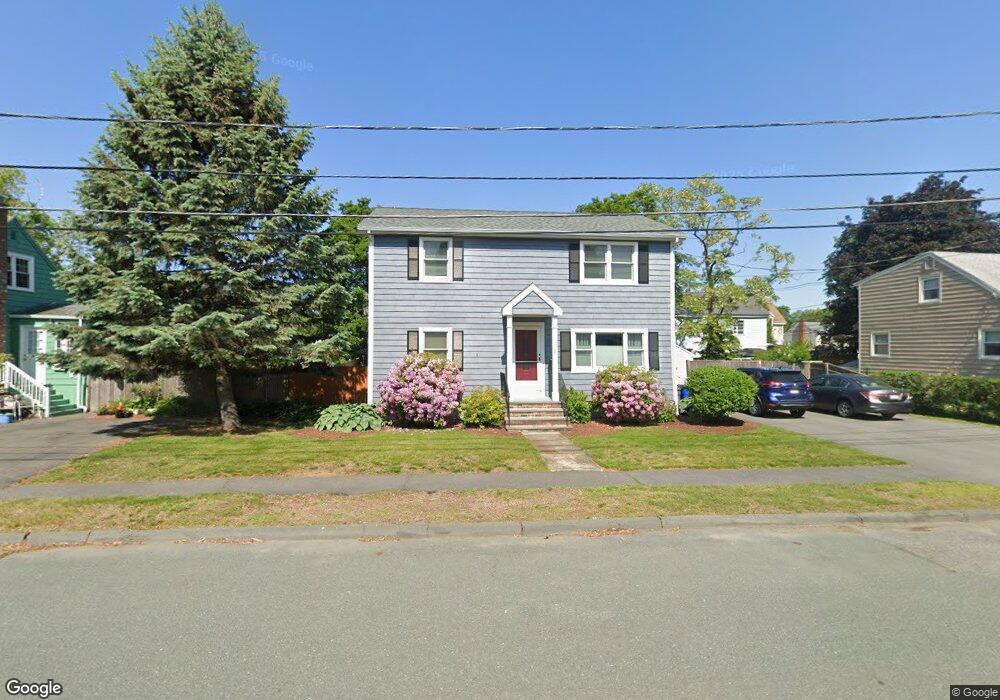
1 Laurel St Peabody, MA 01960
South Peabody NeighborhoodEstimated Value: $682,000 - $733,008
3
Beds
3
Baths
1,536
Sq Ft
$458/Sq Ft
Est. Value
About This Home
This home is located at 1 Laurel St, Peabody, MA 01960 and is currently estimated at $704,252, approximately $458 per square foot. 1 Laurel St is a home located in Essex County with nearby schools including Peabody Veterans Memorial High School and St John The Baptist School.
Ownership History
Date
Name
Owned For
Owner Type
Purchase Details
Closed on
Jun 28, 2005
Sold by
Ferullo Anthony and Ferullo Maria T
Bought by
Mcgrane Kenneth P
Current Estimated Value
Purchase Details
Closed on
Jun 30, 1998
Sold by
Murawski Waldemar J and Murawski Joann
Bought by
Ferullo Anthony and Furfaro Maria T
Purchase Details
Closed on
Mar 1, 1991
Sold by
Freshman Jay S
Bought by
Murawski Waldemar J
Create a Home Valuation Report for This Property
The Home Valuation Report is an in-depth analysis detailing your home's value as well as a comparison with similar homes in the area
Home Values in the Area
Average Home Value in this Area
Purchase History
| Date | Buyer | Sale Price | Title Company |
|---|---|---|---|
| Mcgrane Kenneth P | $345,000 | -- | |
| Ferullo Anthony | $185,000 | -- | |
| Murawski Waldemar J | $142,000 | -- |
Source: Public Records
Mortgage History
| Date | Status | Borrower | Loan Amount |
|---|---|---|---|
| Closed | Murawski Waldemar J | $44,700 | |
| Open | Murawski Waldemar J | $208,000 |
Source: Public Records
Tax History Compared to Growth
Tax History
| Year | Tax Paid | Tax Assessment Tax Assessment Total Assessment is a certain percentage of the fair market value that is determined by local assessors to be the total taxable value of land and additions on the property. | Land | Improvement |
|---|---|---|---|---|
| 2025 | $5,960 | $643,600 | $238,000 | $405,600 |
| 2024 | $5,387 | $590,700 | $238,000 | $352,700 |
| 2023 | $5,488 | $576,500 | $212,500 | $364,000 |
| 2022 | $4,792 | $474,500 | $189,800 | $284,700 |
| 2021 | $4,723 | $450,200 | $172,500 | $277,700 |
| 2020 | $4,950 | $460,900 | $172,500 | $288,400 |
| 2019 | $4,451 | $404,300 | $172,500 | $231,800 |
| 2018 | $3,469 | $302,700 | $156,900 | $145,800 |
| 2017 | $3,303 | $280,900 | $156,900 | $124,000 |
| 2016 | $3,323 | $278,800 | $156,900 | $121,900 |
| 2015 | $3,352 | $272,500 | $152,900 | $119,600 |
Source: Public Records
Map
Nearby Homes
- 5 Quarry Terrace
- 41 Dexter St
- 5 Louis Rd
- 6 Christopher Terrace
- 60 Lynn St
- 17 Janet Ln
- 3 Veterans Memorial Dr
- 19 Arnold Ave
- 2 Crestwood Ln
- 2 Summit Terrace
- 29 Rockway Rd
- 36 Forest St
- 232 Lynn St
- 34 Glendale Ave
- 14 Bartlett St
- 21 Hawthorne Cir
- 4R Forest St
- 45 Ellsworth Rd
- 131 Den Quarry Rd
- 111 Foster St Unit 401