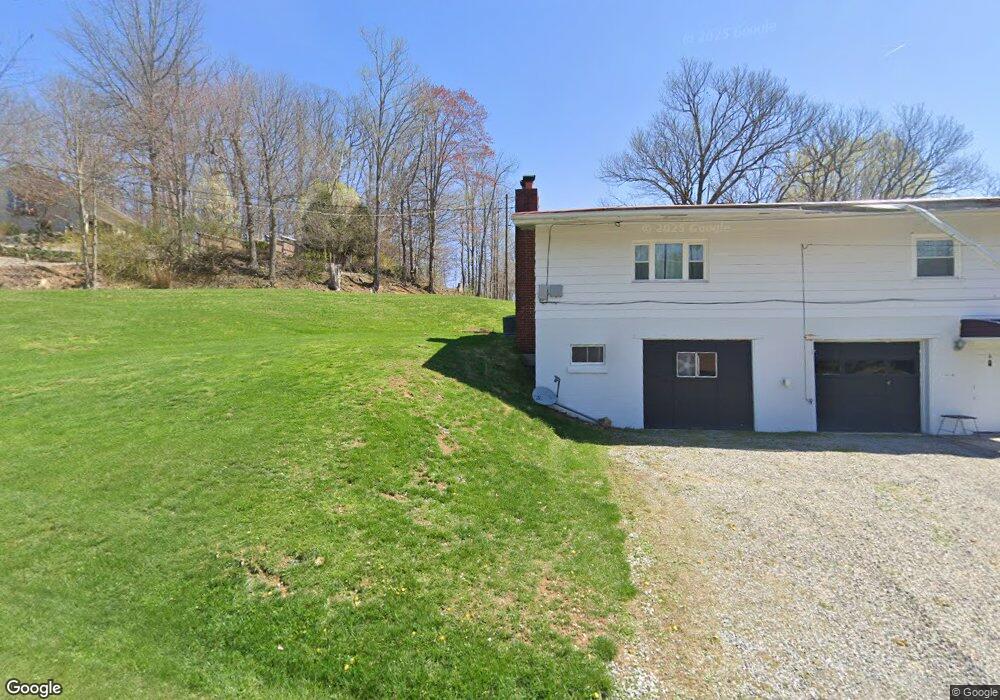
1 Lemon St Buckhannon, WV 26201
Estimated Value: $136,000 - $170,363
2
Beds
2
Baths
1,008
Sq Ft
$148/Sq Ft
Est. Value
About This Home
This home is located at 1 Lemon St, Buckhannon, WV 26201 and is currently estimated at $149,341, approximately $148 per square foot. 1 Lemon St is a home located in Upshur County with nearby schools including Buckhannon Upshur High School, Upshur County Christian Academy, and Brushy Fork Christian School.
Ownership History
Date
Name
Owned For
Owner Type
Purchase Details
Closed on
Jul 23, 2024
Sold by
Page Sheldon B and Page Courtney L
Bought by
Page Sheldon B
Current Estimated Value
Home Financials for this Owner
Home Financials are based on the most recent Mortgage that was taken out on this home.
Original Mortgage
$98,464
Outstanding Balance
$97,258
Interest Rate
6.86%
Mortgage Type
New Conventional
Estimated Equity
$52,083
Purchase Details
Closed on
Jan 6, 2021
Sold by
Ryder Gary B
Bought by
Page Sheldon B and Page Courtney L
Home Financials for this Owner
Home Financials are based on the most recent Mortgage that was taken out on this home.
Original Mortgage
$102,020
Interest Rate
2.6%
Mortgage Type
New Conventional
Purchase Details
Closed on
Jun 29, 2010
Sold by
Stuart Pamela S and Stuart Pamela S
Bought by
Ryder Gary B
Create a Home Valuation Report for This Property
The Home Valuation Report is an in-depth analysis detailing your home's value as well as a comparison with similar homes in the area
Home Values in the Area
Average Home Value in this Area
Purchase History
| Date | Buyer | Sale Price | Title Company |
|---|---|---|---|
| Page Sheldon B | -- | None Listed On Document | |
| Page Sheldon B | -- | None Listed On Document | |
| Page Sheldon B | $98,000 | None Available | |
| Page Sheldon B | $98,000 | None Listed On Document | |
| Ryder Gary B | -- | -- |
Source: Public Records
Mortgage History
| Date | Status | Borrower | Loan Amount |
|---|---|---|---|
| Open | Page Sheldon B | $98,464 | |
| Closed | Page Sheldon B | $98,464 | |
| Previous Owner | Page Sheldon B | $102,020 |
Source: Public Records
Tax History Compared to Growth
Tax History
| Year | Tax Paid | Tax Assessment Tax Assessment Total Assessment is a certain percentage of the fair market value that is determined by local assessors to be the total taxable value of land and additions on the property. | Land | Improvement |
|---|---|---|---|---|
| 2024 | $644 | $67,200 | $13,320 | $53,880 |
| 2023 | $754 | $65,220 | $12,720 | $52,500 |
| 2022 | $754 | $65,280 | $12,720 | $52,560 |
| 2021 | $738 | $63,840 | $12,720 | $51,120 |
| 2020 | $715 | $61,860 | $12,720 | $49,140 |
| 2019 | $697 | $60,300 | $11,700 | $48,600 |
| 2018 | $703 | $60,840 | $11,700 | $49,140 |
| 2017 | $686 | $59,340 | $11,040 | $48,300 |
| 2016 | $679 | $58,740 | $11,040 | $47,700 |
| 2015 | $670 | $58,080 | $11,040 | $47,040 |
| 2014 | $647 | $55,980 | $10,440 | $45,540 |
Source: Public Records
Map
Nearby Homes