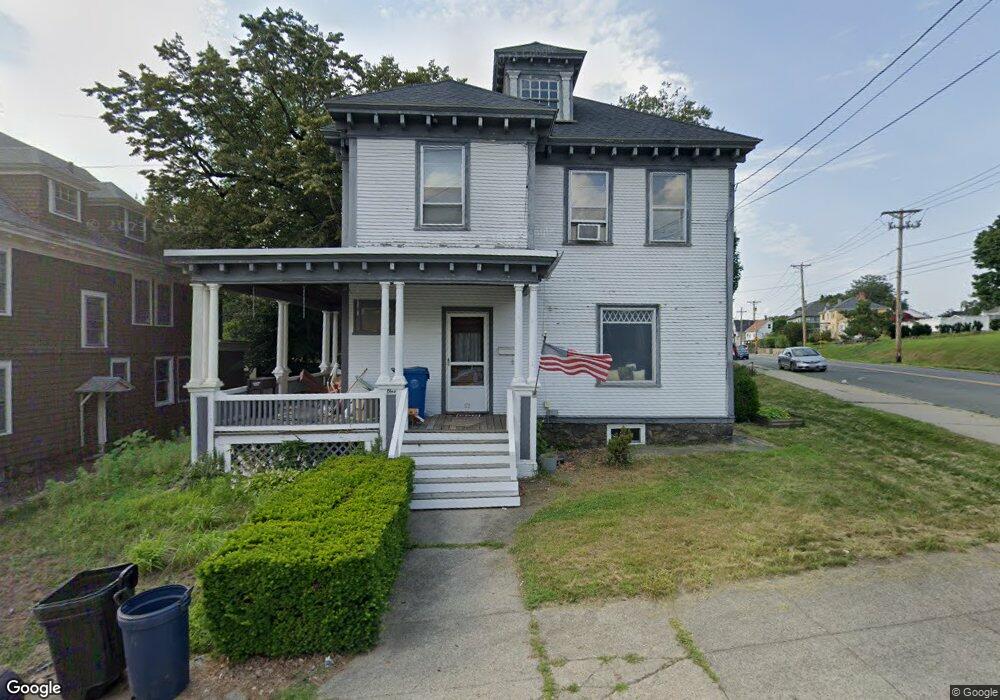
1 Logan St Lawrence, MA 01841
Prospect Hill-Back Bay NeighborhoodEstimated Value: $564,334 - $672,000
4
Beds
1
Bath
2,530
Sq Ft
$243/Sq Ft
Est. Value
About This Home
This home is located at 1 Logan St, Lawrence, MA 01841 and is currently estimated at $615,584, approximately $243 per square foot. 1 Logan St is a home located in Essex County with nearby schools including School For Exceptional Studies, Community Day Charter Public School - Gateway, and Esperanza Academy School of Hope.
Ownership History
Date
Name
Owned For
Owner Type
Purchase Details
Closed on
Jun 24, 1988
Sold by
Benigno John M
Bought by
Benigno John M
Current Estimated Value
Home Financials for this Owner
Home Financials are based on the most recent Mortgage that was taken out on this home.
Original Mortgage
$64,000
Interest Rate
10.32%
Mortgage Type
Purchase Money Mortgage
Create a Home Valuation Report for This Property
The Home Valuation Report is an in-depth analysis detailing your home's value as well as a comparison with similar homes in the area
Home Values in the Area
Average Home Value in this Area
Purchase History
| Date | Buyer | Sale Price | Title Company |
|---|---|---|---|
| Benigno John M | $13,500 | -- |
Source: Public Records
Mortgage History
| Date | Status | Borrower | Loan Amount |
|---|---|---|---|
| Closed | Benigno John M | $84,000 | |
| Closed | Benigno John M | $83,000 | |
| Closed | Benigno John M | $64,000 |
Source: Public Records
Tax History
| Year | Tax Paid | Tax Assessment Tax Assessment Total Assessment is a certain percentage of the fair market value that is determined by local assessors to be the total taxable value of land and additions on the property. | Land | Improvement |
|---|---|---|---|---|
| 2025 | $4,661 | $529,700 | $156,300 | $373,400 |
| 2024 | $4,083 | $441,400 | $115,600 | $325,800 |
| 2023 | $3,817 | $375,700 | $112,800 | $262,900 |
| 2022 | $4,273 | $373,500 | $112,800 | $260,700 |
| 2021 | $4,101 | $334,200 | $112,800 | $221,400 |
| 2020 | $3,814 | $306,800 | $101,400 | $205,400 |
| 2019 | $3,770 | $275,600 | $91,200 | $184,400 |
| 2018 | $3,327 | $232,300 | $78,400 | $153,900 |
| 2017 | $3,234 | $210,800 | $77,500 | $133,300 |
| 2016 | $2,660 | $171,500 | $56,500 | $115,000 |
| 2015 | $2,593 | $171,500 | $56,500 | $115,000 |
Source: Public Records
Map
Nearby Homes
- 5 Kendrick St
- 14 Court St
- 39 Swan Ave
- 25-27 Bicknell Ave
- 192 Union St
- 12 Annette St
- 129-131 Lexington St
- 109 Ferry St
- 106 Leroy Ave
- 2 Leslie St
- 18 Erhardt Terrace
- 131A Lawrence St Unit 40
- 7 Erhardt Terrace
- 264 E Haverhill St Unit 2
- 89 Newbury St Unit 89B
- 80-82 Haverhill St
- 91 Summer St Unit 2
- 32 Josephine Ave
- 7-9 Bennington St
- 173 Jackson St
Your Personal Tour Guide
Ask me questions while you tour the home.