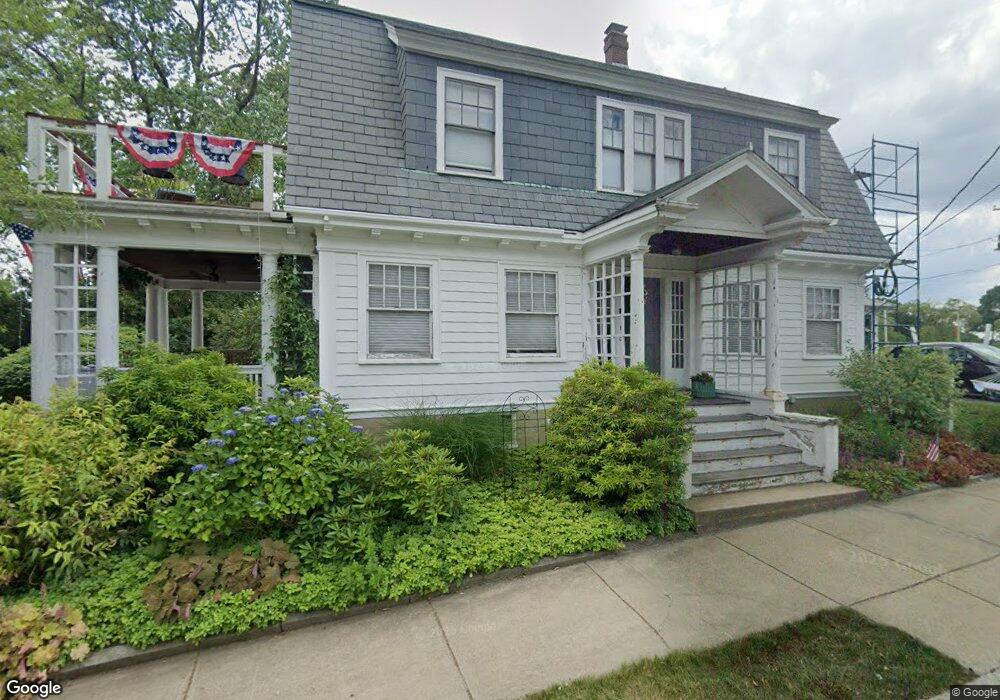
1 Lowell St Salem, MA 01970
Salem Willows NeighborhoodEstimated Value: $1,055,000 - $1,145,000
4
Beds
2
Baths
2,470
Sq Ft
$439/Sq Ft
Est. Value
About This Home
This home is located at 1 Lowell St, Salem, MA 01970 and is currently estimated at $1,083,100, approximately $438 per square foot. 1 Lowell St is a home located in Essex County with nearby schools including Carlton Elementary School, Saltonstall School, and Bates Elementary School.
Ownership History
Date
Name
Owned For
Owner Type
Purchase Details
Closed on
Jun 17, 2013
Sold by
Meche Mark and Meche Kristen
Bought by
Meche Mark J and Meche Kristen R
Current Estimated Value
Purchase Details
Closed on
Oct 15, 1999
Sold by
Stuart W Martin Ret
Bought by
Meche Mark and Meche Kristen
Create a Home Valuation Report for This Property
The Home Valuation Report is an in-depth analysis detailing your home's value as well as a comparison with similar homes in the area
Home Values in the Area
Average Home Value in this Area
Purchase History
| Date | Buyer | Sale Price | Title Company |
|---|---|---|---|
| Meche Mark J | -- | -- | |
| Meche Mark | $325,000 | -- |
Source: Public Records
Mortgage History
| Date | Status | Borrower | Loan Amount |
|---|---|---|---|
| Previous Owner | Meche Mark | $545,000 | |
| Previous Owner | Meche Mark | $70,000 | |
| Previous Owner | Meche Mark | $322,700 |
Source: Public Records
Tax History Compared to Growth
Tax History
| Year | Tax Paid | Tax Assessment Tax Assessment Total Assessment is a certain percentage of the fair market value that is determined by local assessors to be the total taxable value of land and additions on the property. | Land | Improvement |
|---|---|---|---|---|
| 2025 | $10,856 | $957,300 | $284,300 | $673,000 |
| 2024 | $10,603 | $912,500 | $271,000 | $641,500 |
| 2023 | $10,086 | $806,200 | $251,200 | $555,000 |
| 2022 | $9,508 | $717,600 | $238,000 | $479,600 |
| 2021 | $9,697 | $702,700 | $231,400 | $471,300 |
| 2020 | $9,564 | $661,900 | $231,400 | $430,500 |
| 2019 | $9,542 | $631,900 | $231,400 | $400,500 |
| 2018 | $9,265 | $602,400 | $221,500 | $380,900 |
| 2017 | $8,970 | $565,600 | $198,300 | $367,300 |
| 2016 | $8,604 | $549,100 | $181,800 | $367,300 |
| 2015 | $8,458 | $515,400 | $181,800 | $333,600 |
Source: Public Records
Map
Nearby Homes
- 23 Beach Ave Unit 1
- 112 Bay View Ave
- 117 Water St Unit 28
- 10 Quincy Park
- 1 Quincy Park
- 7 Lothrop St
- 7 Oxford Terrace
- 40 & 40R Stone St
- 43 Front St
- 12 Thorndike St
- 14 Lathrop St
- 21 Emerton St Unit 2
- 9.5 Fayette Unit 9.5
- 12 Fayette St Unit 4
- 21 Summit Ave Unit 2
- 40 Essex St Unit 2
- 103 Bridge St Unit 2
- 10 Andrew St Unit 2A
- 39 & 41 Woodbury St
- 60 Rantoul St Unit 711N