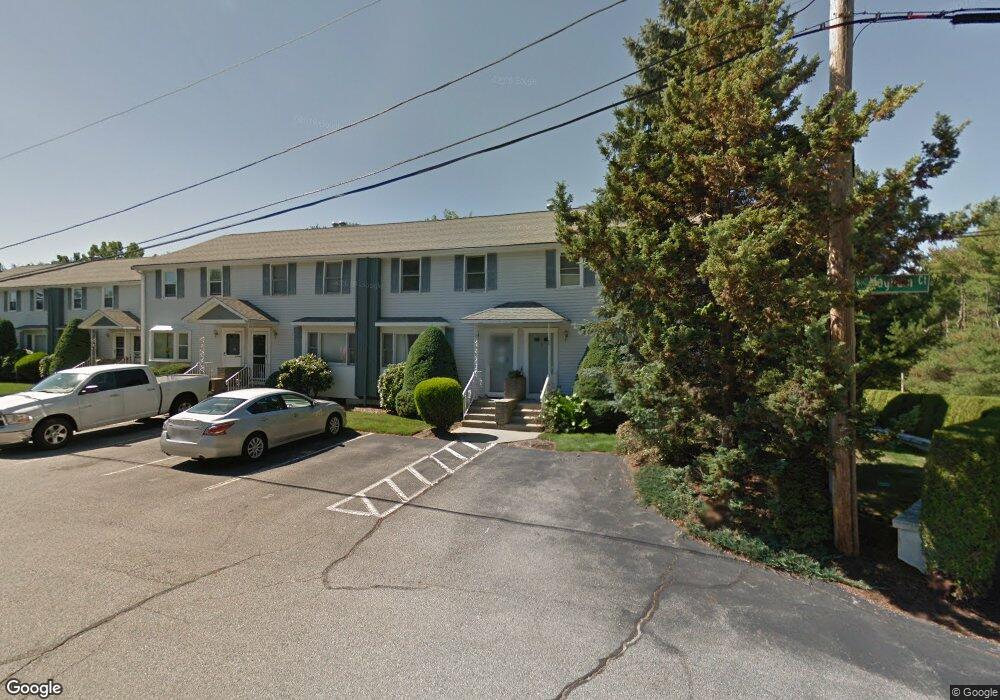
1 Magnum Ct Smithfield, RI 02917
Estimated Value: $363,000 - $406,000
2
Beds
2
Baths
1,200
Sq Ft
$322/Sq Ft
Est. Value
About This Home
This home is located at 1 Magnum Ct, Smithfield, RI 02917 and is currently estimated at $385,858, approximately $321 per square foot. 1 Magnum Ct is a home located in Providence County with nearby schools including Vincent J. Gallagher Middle School, Smithfield High School, and St. Augustine School.
Ownership History
Date
Name
Owned For
Owner Type
Purchase Details
Closed on
Jan 27, 2025
Sold by
Gummo Norma
Bought by
Norma Jean Gummo T and Norma Gummo
Current Estimated Value
Purchase Details
Closed on
Jan 17, 2025
Sold by
Inacio Melissa N and Inacio Eduardo A
Bought by
Gummo Norma
Purchase Details
Closed on
Jun 2, 2004
Sold by
Td Condominium Llc
Bought by
Littauer Blake and Littauer Mariah
Purchase Details
Closed on
Apr 21, 2003
Sold by
T D Condominium Llc
Bought by
Defalco Stephen
Purchase Details
Closed on
Jan 14, 2000
Sold by
Td Condo Llc
Bought by
Farland Shanon L
Purchase Details
Closed on
Mar 24, 1999
Sold by
Td Condo Llc
Bought by
Prue Shirley
Create a Home Valuation Report for This Property
The Home Valuation Report is an in-depth analysis detailing your home's value as well as a comparison with similar homes in the area
Home Values in the Area
Average Home Value in this Area
Purchase History
We collect this data history from publicly available records. To have your information removed, we recommend requesting removal directly through your county’s website.
| Date | Buyer | Sale Price | Title Company |
|---|---|---|---|
| Norma Jean Gummo T | -- | None Available | |
| Norma Jean Gummo T | -- | None Available | |
| Norma Jean Gummo T | -- | None Available | |
| Gummo Norma | $399,000 | None Available | |
| Gummo Norma | $399,000 | None Available | |
| Gummo Norma | $399,000 | None Available | |
| Littauer Blake | $210,000 | -- | |
| Littauer Blake | $210,000 | -- | |
| Defalco Stephen | $185,000 | -- | |
| Defalco Stephen | $185,000 | -- | |
| Farland Shanon L | $100,000 | -- | |
| Farland Shanon L | $100,000 | -- | |
| Prue Shirley | $90,500 | -- | |
| Prue Shirley | $90,500 | -- |
Source: Public Records
Mortgage History
We collect this data history from publicly available records. To have your information removed, we recommend requesting removal directly through your county’s website.
| Date | Status | Borrower | Loan Amount |
|---|---|---|---|
| Previous Owner | Prue Shirley | $166,900 | |
| Previous Owner | Prue Shirley | $20,700 |
Source: Public Records
Tax History
| Year | Tax Paid | Tax Assessment Tax Assessment Total Assessment is a certain percentage of the fair market value that is determined by local assessors to be the total taxable value of land and additions on the property. | Land | Improvement |
|---|---|---|---|---|
| 2025 | $3,832 | $309,300 | $0 | $309,300 |
| 2024 | $3,060 | $211,900 | $0 | $211,900 |
| 2023 | $2,907 | $211,900 | $0 | $211,900 |
| 2022 | $2,831 | $211,900 | $0 | $211,900 |
| 2021 | $2,617 | $152,800 | $0 | $152,800 |
| 2020 | $2,569 | $152,800 | $0 | $152,800 |
| 2019 | $2,569 | $152,800 | $0 | $152,800 |
| 2018 | $2,355 | $134,100 | $0 | $134,100 |
| 2017 | $2,355 | $134,100 | $0 | $134,100 |
| 2016 | $2,243 | $134,100 | $0 | $134,100 |
| 2015 | $2,477 | $141,000 | $0 | $141,000 |
| 2012 | $2,797 | $174,600 | $0 | $174,600 |
Source: Public Records
Map
Nearby Homes
- 2 Magnum Ct Unit 22
- 70 Cedar Swamp Rd
- 3 Stony Ln
- 9 Finne Rd
- 13 Willow Rd
- 56 Pleasant View Ave
- 929 Greenville Ave
- 27 Douglas Cir
- 24 Breezy Knoll Rd
- 48 Indian Run Trail
- 31 Beverly Cir
- 1 Old County Village Way Unit E
- 74 Anglewood Ave
- 14 Candlewood Dr
- 73 Deer Run Trail
- 2 A Old County Village Way Unit B
- 2 A Old County Village Way Unit A
- 63 Esmond St Unit A
- 8 Wolf Hill Rd
- 0 Anglewood Ave
- 1 Magnum Ct Unit 2
- 1 Magnum Ct Unit 8
- 1 Magnum Ct Unit 6
- 1 Magnum Ct Unit 5
- 1 Magnum Ct Unit 3
- 25 Magnum Ct Unit 21
- 25 Magnum Ct Unit 19
- 25 Magnum Ct Unit 18
- 25 Magnum Ct Unit 20
- 25 Magnum Ct Unit 8
- 2 Magnum Ct Unit 25
- 2 Magnum Ct Unit 23
- 2 Magnum Ct Unit 28
- 2 Magnum Ct Unit 26
- 2 Magnum Ct Unit 29
- 2 Magnum Ct Unit 27
- 2 Magnum Ct Unit 24
- 2 Magnum Ct
- 5 Apple Valley Pkwy Unit 9
- 5 Apple Valley Pkwy Unit 4
Your Personal Tour Guide
Ask me questions while you tour the home.