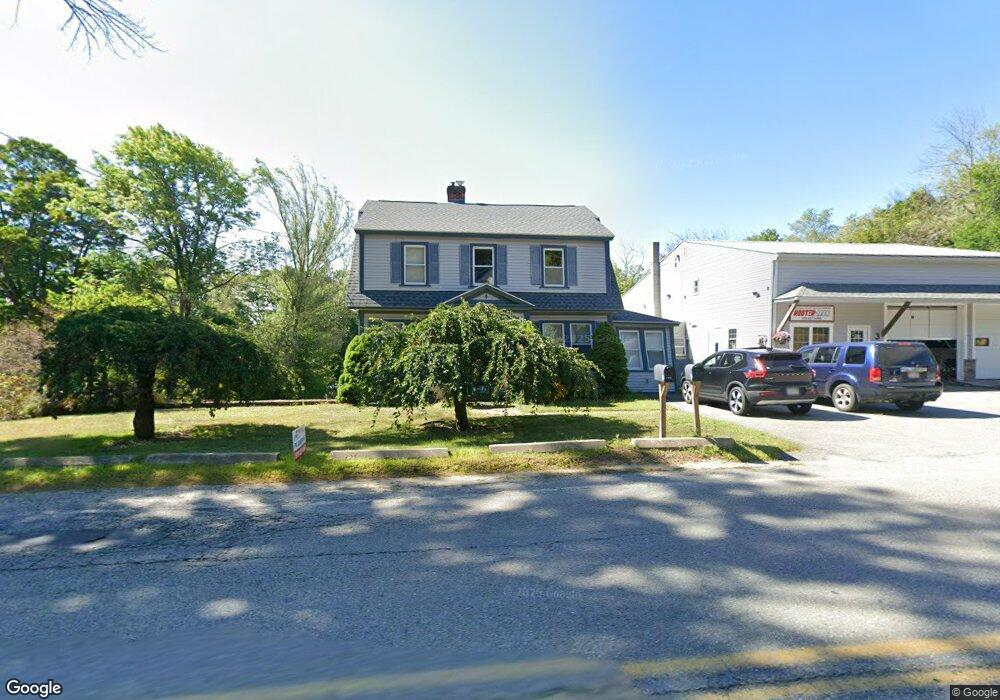
1 Main St Ashburnham, MA 01430
Estimated Value: $374,132 - $598,000
3
Beds
2
Baths
1,568
Sq Ft
$288/Sq Ft
Est. Value
About This Home
This home is located at 1 Main St, Ashburnham, MA 01430 and is currently estimated at $452,283, approximately $288 per square foot. 1 Main St is a home located in Worcester County with nearby schools including Oakmont Regional High School and Cushing Academy.
Ownership History
Date
Name
Owned For
Owner Type
Purchase Details
Closed on
Oct 25, 2021
Sold by
Asl Property Services Llc
Bought by
Ctb Enterprises Inc
Current Estimated Value
Purchase Details
Closed on
Feb 3, 2017
Sold by
1-3 Main Street Rt and Martikainen
Bought by
Asl Property Services
Home Financials for this Owner
Home Financials are based on the most recent Mortgage that was taken out on this home.
Original Mortgage
$325,000
Interest Rate
4.3%
Mortgage Type
Commercial
Purchase Details
Closed on
Nov 4, 2011
Sold by
Martikainen Ft and Martikainen
Bought by
1-3 Main Street Rt and Martikainen
Create a Home Valuation Report for This Property
The Home Valuation Report is an in-depth analysis detailing your home's value as well as a comparison with similar homes in the area
Home Values in the Area
Average Home Value in this Area
Purchase History
| Date | Buyer | Sale Price | Title Company |
|---|---|---|---|
| Ctb Enterprises Inc | $420,000 | None Available | |
| Ctb Enterprises Inc | $420,000 | None Available | |
| Ctb Enterprises Inc | $420,000 | None Available | |
| Asl Property Services | $345,000 | -- | |
| Asl Property Services | $345,000 | -- | |
| 1-3 Main Street Rt | -- | -- | |
| Asl Property Services | $345,000 | -- | |
| 1-3 Main Street Rt | -- | -- |
Source: Public Records
Mortgage History
| Date | Status | Borrower | Loan Amount |
|---|---|---|---|
| Previous Owner | Asl Property Services | $325,000 |
Source: Public Records
Tax History Compared to Growth
Tax History
| Year | Tax Paid | Tax Assessment Tax Assessment Total Assessment is a certain percentage of the fair market value that is determined by local assessors to be the total taxable value of land and additions on the property. | Land | Improvement |
|---|---|---|---|---|
| 2025 | $4,937 | $332,000 | $32,800 | $299,200 |
| 2024 | $4,705 | $298,700 | $32,800 | $265,900 |
| 2023 | $4,530 | $273,700 | $32,800 | $240,900 |
| 2022 | $4,807 | $254,600 | $32,600 | $222,000 |
| 2021 | $4,605 | $224,100 | $32,600 | $191,500 |
| 2020 | $4,504 | $224,100 | $32,600 | $191,500 |
| 2019 | $4,361 | $193,400 | $32,600 | $160,800 |
| 2018 | $4,310 | $184,200 | $31,100 | $153,100 |
| 2017 | $8,260 | $359,600 | $101,000 | $258,600 |
| 2016 | $7,992 | $351,300 | $99,800 | $251,500 |
| 2015 | $7,553 | $339,000 | $99,800 | $239,200 |
Source: Public Records
Map
Nearby Homes
- 9 Willard Rd
- 30 Russell Hill Rd
- 48 Willard Rd
- 136 Willard Rd
- 18 Corey Hill Rd
- 101 Russell Hill Rd
- 189 Fitchburg Rd
- 152 Ashby Rd
- 179 Cashman Hill Rd
- 134 Stodge Meadow Rd
- 66 S Main St
- Lot 40C Winchendon Rd
- 0 Holt Rd
- 40 Hunter Ave
- Lot 3 W State Rd
- 15 Kirali Ct
- 0 Rindge Turnpike
- 84 Murray Rd
- 70 Ashburnham State Rd
- 208 Bean Porridge Hill Rd