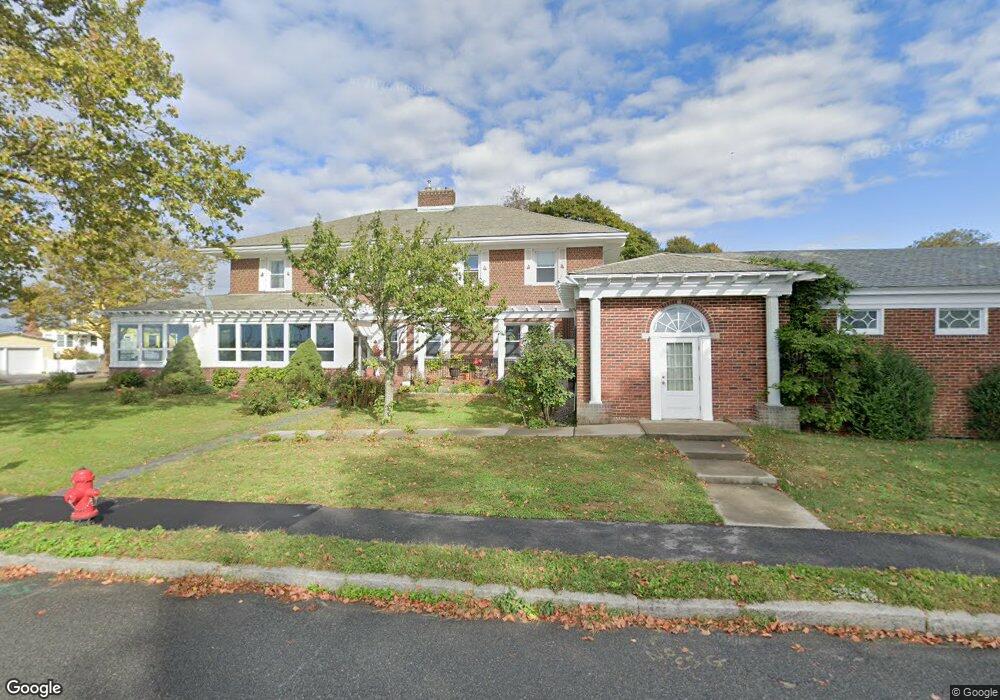
1 Main St Fairhaven, MA 02719
Estimated Value: $1,415,000 - $2,002,483
8
Beds
8
Baths
6,248
Sq Ft
$269/Sq Ft
Est. Value
About This Home
This home is located at 1 Main St, Fairhaven, MA 02719 and is currently estimated at $1,679,828, approximately $268 per square foot. 1 Main St is a home located in Bristol County with nearby schools including Fairhaven High School, City On A Hill Charter Public School New Bedford, and St. Joseph School.
Ownership History
Date
Name
Owned For
Owner Type
Purchase Details
Closed on
Jan 28, 2019
Sold by
Budryk Francis J
Bought by
Rchhc Realty Llc
Current Estimated Value
Home Financials for this Owner
Home Financials are based on the most recent Mortgage that was taken out on this home.
Original Mortgage
$800,000
Outstanding Balance
$704,763
Interest Rate
4.6%
Mortgage Type
Purchase Money Mortgage
Estimated Equity
$975,065
Purchase Details
Closed on
Dec 22, 2008
Sold by
Coop Bank and Ledogar Sandra A
Bought by
Budryk Francis J
Home Financials for this Owner
Home Financials are based on the most recent Mortgage that was taken out on this home.
Original Mortgage
$17,500
Interest Rate
6.03%
Purchase Details
Closed on
Aug 23, 2005
Sold by
Ledogar Sandra A and Ledogar Stephen J
Bought by
Sweeney John B and Sweeney Margaret A
Create a Home Valuation Report for This Property
The Home Valuation Report is an in-depth analysis detailing your home's value as well as a comparison with similar homes in the area
Home Values in the Area
Average Home Value in this Area
Purchase History
| Date | Buyer | Sale Price | Title Company |
|---|---|---|---|
| Rchhc Realty Llc | $804,100 | -- | |
| Budryk Francis J | $675,000 | -- | |
| Sweeney John B | $275,000 | -- |
Source: Public Records
Mortgage History
| Date | Status | Borrower | Loan Amount |
|---|---|---|---|
| Open | Rchhc Realty Llc | $800,000 | |
| Previous Owner | Sweeney John B | $17,500 | |
| Previous Owner | Sweeney John B | $675,000 | |
| Previous Owner | Sweeney John B | $360,000 |
Source: Public Records
Tax History Compared to Growth
Tax History
| Year | Tax Paid | Tax Assessment Tax Assessment Total Assessment is a certain percentage of the fair market value that is determined by local assessors to be the total taxable value of land and additions on the property. | Land | Improvement |
|---|---|---|---|---|
| 2025 | $138 | $1,478,500 | $335,900 | $1,142,600 |
| 2024 | $13,512 | $1,463,900 | $335,900 | $1,128,000 |
| 2023 | $12,721 | $1,278,500 | $285,500 | $993,000 |
| 2022 | $13,079 | $1,279,700 | $259,500 | $1,020,200 |
| 2021 | $13,260 | $1,174,500 | $259,500 | $915,000 |
| 2020 | $11,258 | $1,017,900 | $259,500 | $758,400 |
| 2019 | $11,348 | $972,400 | $236,600 | $735,800 |
| 2018 | $11,566 | $950,400 | $236,600 | $713,800 |
| 2017 | $11,303 | $938,800 | $236,600 | $702,200 |
| 2016 | $11,064 | $908,400 | $236,600 | $671,800 |
| 2015 | $10,671 | $878,300 | $213,700 | $664,600 |
Source: Public Records
Map
Nearby Homes