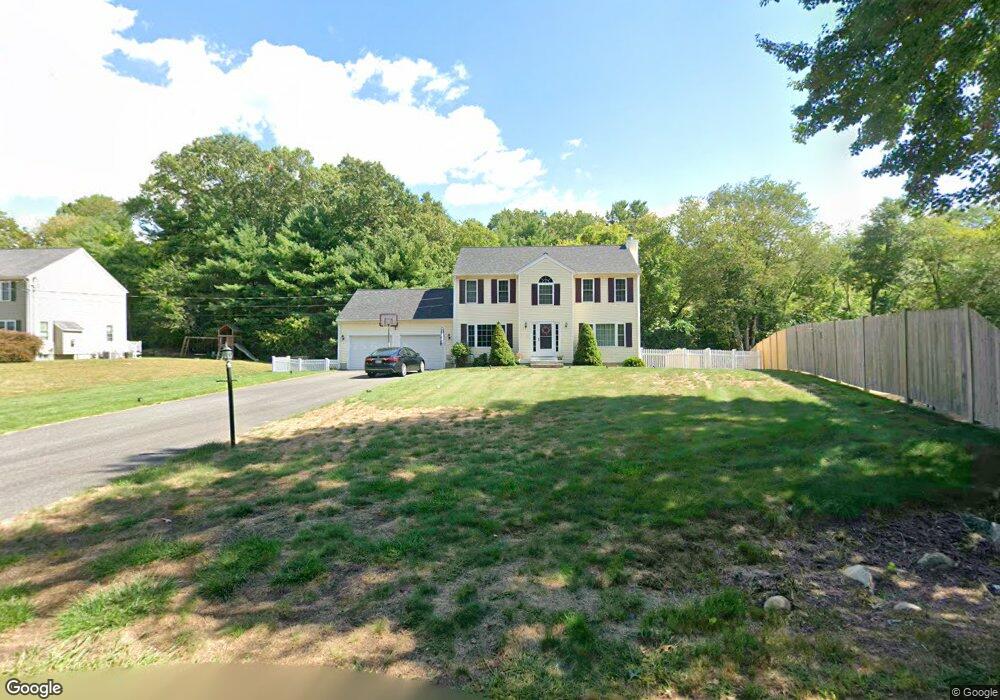
1 Maple Rd Middleboro, MA 02346
Estimated Value: $625,000 - $743,000
3
Beds
2
Baths
1,652
Sq Ft
$409/Sq Ft
Est. Value
About This Home
This home is located at 1 Maple Rd, Middleboro, MA 02346 and is currently estimated at $675,287, approximately $408 per square foot. 1 Maple Rd is a home located in Plymouth County with nearby schools including Mary K. Goode Elementary School and Chamberlain International School.
Ownership History
Date
Name
Owned For
Owner Type
Purchase Details
Closed on
Dec 29, 2003
Sold by
Ags Dev Corp
Bought by
Tenorio Albert T and Tenorio Jocelyn B
Current Estimated Value
Home Financials for this Owner
Home Financials are based on the most recent Mortgage that was taken out on this home.
Original Mortgage
$332,350
Interest Rate
6.01%
Mortgage Type
Purchase Money Mortgage
Create a Home Valuation Report for This Property
The Home Valuation Report is an in-depth analysis detailing your home's value as well as a comparison with similar homes in the area
Home Values in the Area
Average Home Value in this Area
Purchase History
| Date | Buyer | Sale Price | Title Company |
|---|---|---|---|
| Tenorio Albert T | $349,900 | -- |
Source: Public Records
Mortgage History
| Date | Status | Borrower | Loan Amount |
|---|---|---|---|
| Open | Tenorio Albert T | $276,000 | |
| Closed | Tenorio Albert T | $295,716 | |
| Closed | Tenorio Albert T | $332,350 |
Source: Public Records
Tax History
| Year | Tax Paid | Tax Assessment Tax Assessment Total Assessment is a certain percentage of the fair market value that is determined by local assessors to be the total taxable value of land and additions on the property. | Land | Improvement |
|---|---|---|---|---|
| 2025 | $7,461 | $556,400 | $162,200 | $394,200 |
| 2024 | $7,498 | $553,800 | $154,500 | $399,300 |
| 2023 | $6,859 | $481,700 | $154,500 | $327,200 |
| 2022 | $6,357 | $413,300 | $134,300 | $279,000 |
| 2021 | $6,272 | $385,500 | $117,800 | $267,700 |
| 2020 | $5,988 | $377,100 | $117,800 | $259,300 |
| 2019 | $5,838 | $377,100 | $117,800 | $259,300 |
| 2018 | $5,427 | $347,900 | $111,900 | $236,000 |
| 2017 | $5,029 | $318,900 | $107,700 | $211,200 |
| 2016 | $4,883 | $306,700 | $98,800 | $207,900 |
| 2015 | $4,668 | $295,800 | $98,600 | $197,200 |
Source: Public Records
Map
Nearby Homes
- 958 Centre St
- 132 Everett St
- 80 Forest St
- 246 Everett St
- 145 Wesley Cir
- 75 Oak St
- 218 Old Center St
- 28 Haskell Cir
- 87 Pearl St
- 28 School St
- 23 Taunton St
- 0 Murdock St Unit 73473837
- 6 Rock St
- 0 Wareham Miller St Unit 73410845
- 1 Bloomfield Ave
- 240 N Main St
- 18 Rock St
- 15 E Grove St
- 3 Old Field Way Unit 3
- 50 Cross St
- 1 Maple Rd
- 3 Maple Rd
- 3 Maple Rd
- 5 Maple Rd
- 300 Old Center St
- 296 Old Center St
- 7 Maple Rd
- 7 Maple Rd
- 9 Maple Rd
- 0 Maple Road Lot-33 Unit 50308424
- 304 Old Center St
- 295 Old Center St
- 28 Erica Ave
- 303 Old Center St
- 26 Erica Ave
- 306 Old Center St
- 23 Erica Ave
- 21 Erica Ave
- 24 Erica Ave
- 310 Old Center St
Your Personal Tour Guide
Ask me questions while you tour the home.