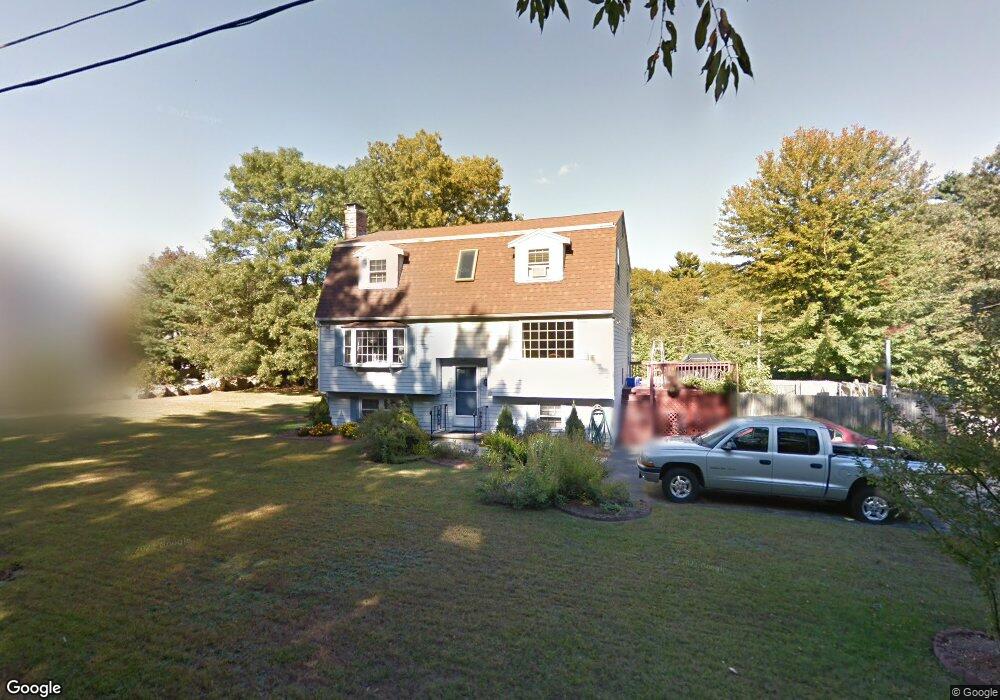
1 Marrietta Ave Wilmington, MA 01887
Estimated Value: $769,859 - $887,000
3
Beds
2
Baths
1,694
Sq Ft
$484/Sq Ft
Est. Value
About This Home
This home is located at 1 Marrietta Ave, Wilmington, MA 01887 and is currently estimated at $820,215, approximately $484 per square foot. 1 Marrietta Ave is a home located in Middlesex County with nearby schools including Wilmington Middle School, Wilmington High School, and Abundant Life Christian School and Childcare.
Ownership History
Date
Name
Owned For
Owner Type
Purchase Details
Closed on
Aug 12, 2021
Sold by
Ricci Rhina A and Ricci Frederic J
Bought by
Andrew J Ricci Ret
Current Estimated Value
Purchase Details
Closed on
Jan 15, 1991
Sold by
Lor-Ral Rt
Bought by
Ricci Frederick J and Rhina A Ricci
Create a Home Valuation Report for This Property
The Home Valuation Report is an in-depth analysis detailing your home's value as well as a comparison with similar homes in the area
Purchase History
| Date | Buyer | Sale Price | Title Company |
|---|---|---|---|
| Andrew J Ricci Ret | -- | None Available | |
| Ricci Frederick J | $175,000 | -- |
Source: Public Records
Mortgage History
| Date | Status | Borrower | Loan Amount |
|---|---|---|---|
| Previous Owner | Ricci Frederick J | $70,000 | |
| Previous Owner | Ricci Frederick J | $150,000 | |
| Previous Owner | Ricci Frederick J | $138,000 | |
| Previous Owner | Ricci Frederick J | $138,300 |
Source: Public Records
Tax History
| Year | Tax Paid | Tax Assessment Tax Assessment Total Assessment is a certain percentage of the fair market value that is determined by local assessors to be the total taxable value of land and additions on the property. | Land | Improvement |
|---|---|---|---|---|
| 2025 | $7,939 | $693,400 | $300,200 | $393,200 |
| 2024 | $7,616 | $666,300 | $300,200 | $366,100 |
| 2023 | $7,205 | $603,400 | $272,900 | $330,500 |
| 2022 | $6,838 | $524,800 | $227,400 | $297,400 |
| 2021 | $6,801 | $491,400 | $206,700 | $284,700 |
| 2020 | $6,798 | $500,600 | $206,700 | $293,900 |
| 2019 | $6,314 | $459,200 | $196,900 | $262,300 |
| 2018 | $6,127 | $423,000 | $187,500 | $235,500 |
| 2017 | $6,127 | $424,000 | $179,300 | $244,700 |
| 2016 | $5,769 | $394,300 | $170,800 | $223,500 |
| 2015 | $5,347 | $372,100 | $170,800 | $201,300 |
| 2014 | $4,970 | $349,000 | $162,600 | $186,400 |
Source: Public Records
Map
Nearby Homes
- 255 Burlington Ave
- 224 Burlington Ave
- 6 Patricia Cir
- 48 Brand Ave
- 56 Grove Ave
- 44 Connolly Rd
- 3 Clark Terrace
- 31 Burlington Ave
- 6 Glade St
- 3 Memory Ln
- 35 Oak St
- 95 Bellflower Rd
- 29 Beaverbrook Rd
- 25 Mill Rd
- 7 Cross St Unit 303
- 7 Cross St Unit 205
- 7 Cross St Unit 102
- 6 Jonathan Rd
- 3 Molloy Rd
- 3 Shawnee Cir
Your Personal Tour Guide
Ask me questions while you tour the home.