1 Mary St Windham, NH 03087
Estimated Value: $727,000 - $808,000
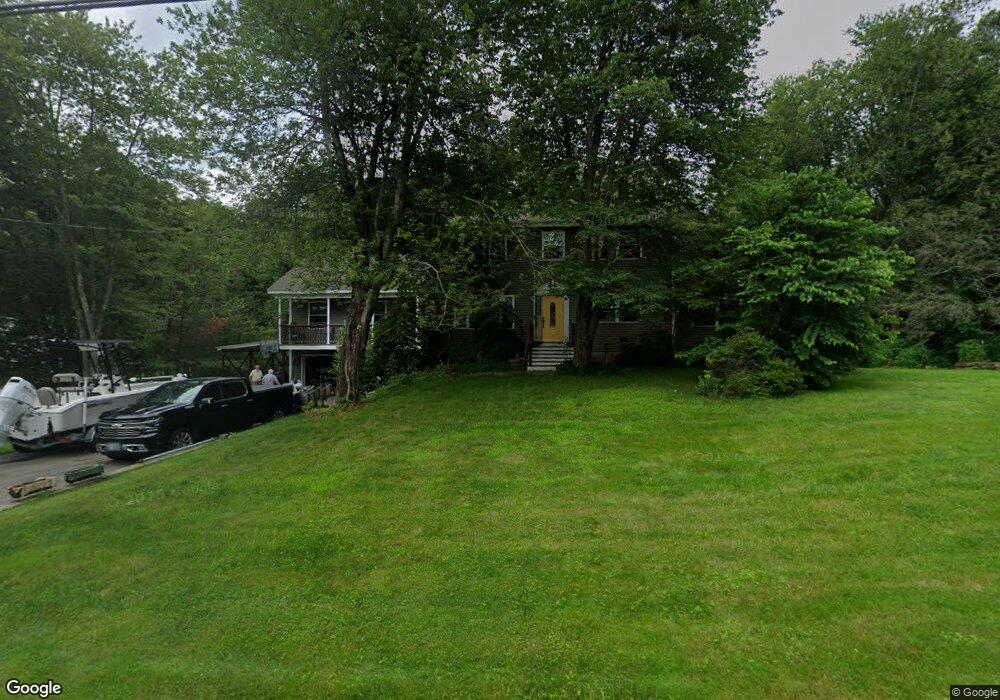
About This Home
This home is located at 1 Mary St, Windham, NH 03087 and is currently estimated at $762,196, approximately $294 per square foot. 1 Mary St is a home located in Rockingham County with nearby schools including Golden Brook Elementary School, Windham Middle School, and Windham High School.
Ownership History
We collect this data history from publicly available records. To have your information removed, we recommend requesting removal directly through your county’s website.
Purchase Details
Home Values in the Area
Average Home Value in this Area
Purchase History
We collect this data history from publicly available records. To have your information removed, we recommend requesting removal directly through your county’s website.
| Date | Buyer | Sale Price | Title Company |
|---|---|---|---|
| $145,000 | -- |
Mortgage History
We collect this data history from publicly available records. To have your information removed, we recommend requesting removal directly through your county’s website.
| Date | Status | Borrower | Loan Amount |
|---|---|---|---|
| Open | $226,000 | ||
| Closed | $231,000 | ||
| Closed | $15,400 |
Tax History
We collect this data history from publicly available records. To have your information removed, we recommend requesting removal directly through your county’s website.
| Year | Tax Paid | Tax Assessment Tax Assessment Total Assessment is a certain percentage of the fair market value that is determined by local assessors to be the total taxable value of land and additions on the property. | Land | Improvement |
|---|---|---|---|---|
| 2025 | $9,942 | $702,600 | $245,400 | $457,200 |
| 2024 | $9,511 | $420,100 | $153,400 | $266,700 |
| 2023 | $8,990 | $420,100 | $153,400 | $266,700 |
| 2022 | $8,301 | $420,100 | $153,400 | $266,700 |
| 2021 | $7,822 | $420,100 | $153,400 | $266,700 |
| 2020 | $8,037 | $420,100 | $153,400 | $266,700 |
| 2019 | $6,783 | $300,800 | $141,400 | $159,400 |
| 2018 | $6,982 | $299,800 | $141,400 | $158,400 |
| 2017 | $6,056 | $299,800 | $141,400 | $158,400 |
| 2016 | $6,542 | $299,800 | $141,400 | $158,400 |
| 2015 | $6,512 | $299,800 | $141,400 | $158,400 |
| 2014 | $6,926 | $288,600 | $149,000 | $139,600 |
| 2013 | $6,735 | $285,400 | $149,000 | $136,400 |
Map
- 13 Sunridge Rd
- 6 Misty Meadow Rd
- 117 Castle Hill Rd
- 48 Brookview Rd
- 153 Castle Hill Rd
- 2 Del Ray Dr
- 84, 86, 88 Ryan Farm Rd Unit 1, 2, 3
- 6 Bancroft St
- 4 Cypress Ln Unit 10
- 23 Ryan Farm Rd
- 53 Sullivan Rd
- 5 Ryan Farm Rd
- 15 Castle Hill Rd
- 22 Rolling Woods Dr
- 6 Mammoth Rd
- 119 Haverhill Rd
- 2 Hillside Dr
- 9 Venus Way Unit 23
- 15A David Dr
- 7 Wilson Rd
Ask me questions while you tour the home.