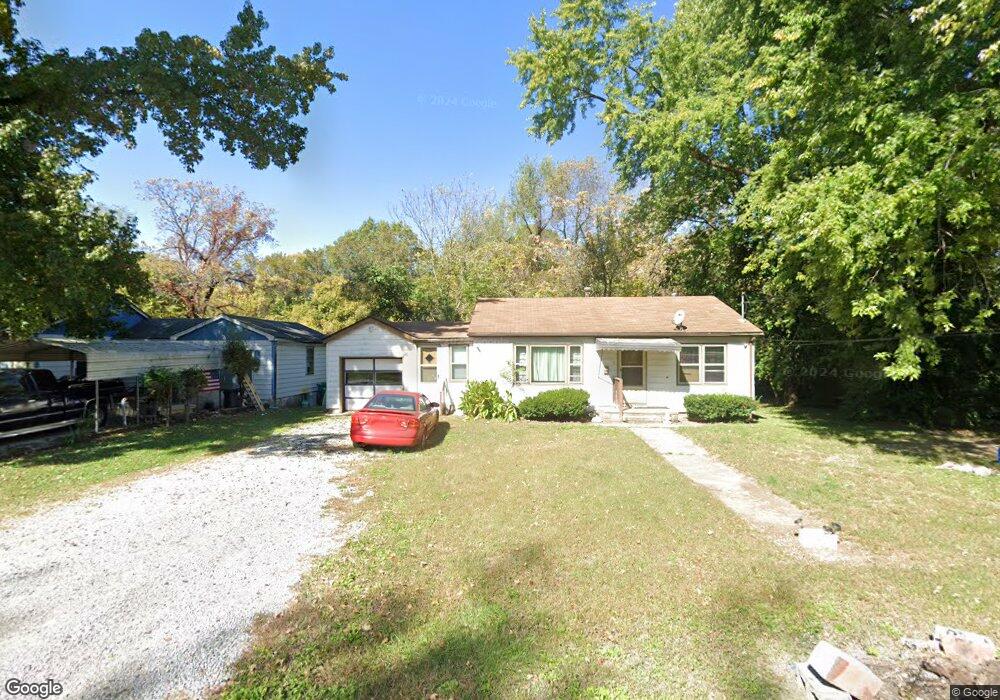
1 Marydale East Saint Louis, IL 62207
Estimated Value: $29,000 - $49,000
--
Bed
--
Bath
896
Sq Ft
$47/Sq Ft
Est. Value
About This Home
This home is located at 1 Marydale, East Saint Louis, IL 62207 and is currently estimated at $42,301, approximately $47 per square foot. 1 Marydale is a home located in St. Clair County.
Ownership History
Date
Name
Owned For
Owner Type
Purchase Details
Closed on
Apr 11, 2017
Sold by
County Of St Clair
Bought by
Hawk Properties Inc
Current Estimated Value
Purchase Details
Closed on
Feb 3, 2006
Sold by
Wachovia Bank Of Delaware Na
Bought by
Harris Randell
Purchase Details
Closed on
Oct 28, 2005
Sold by
Smith Raymond
Bought by
Wachovia Bank Of Delaware Na
Purchase Details
Closed on
Apr 15, 1994
Sold by
Bruner Sylvia
Bought by
Smith Raymond and Smith Arteria
Home Financials for this Owner
Home Financials are based on the most recent Mortgage that was taken out on this home.
Original Mortgage
$32,000
Interest Rate
7.91%
Mortgage Type
Balloon
Create a Home Valuation Report for This Property
The Home Valuation Report is an in-depth analysis detailing your home's value as well as a comparison with similar homes in the area
Home Values in the Area
Average Home Value in this Area
Purchase History
| Date | Buyer | Sale Price | Title Company |
|---|---|---|---|
| Hawk Properties Inc | -- | None Available | |
| Harris Randell | $9,500 | Real Title Service Corp | |
| Wachovia Bank Of Delaware Na | -- | -- | |
| Smith Raymond | $17,000 | Nations Title Of Louisiana |
Source: Public Records
Mortgage History
| Date | Status | Borrower | Loan Amount |
|---|---|---|---|
| Previous Owner | Smith Raymond | $32,000 |
Source: Public Records
Tax History Compared to Growth
Tax History
| Year | Tax Paid | Tax Assessment Tax Assessment Total Assessment is a certain percentage of the fair market value that is determined by local assessors to be the total taxable value of land and additions on the property. | Land | Improvement |
|---|---|---|---|---|
| 2024 | $1,368 | $6,935 | $809 | $6,126 |
| 2023 | $1,234 | $6,268 | $731 | $5,537 |
| 2022 | $1,126 | $5,494 | $641 | $4,853 |
| 2021 | $1,173 | $5,206 | $607 | $4,599 |
| 2020 | $1,133 | $5,051 | $637 | $4,414 |
| 2019 | $1,158 | $5,051 | $637 | $4,414 |
| 2018 | $1,153 | $5,124 | $646 | $4,478 |
| 2017 | $1,418 | $5,000 | $630 | $4,370 |
| 2016 | $1,743 | $7,235 | $629 | $6,606 |
| 2014 | $1,401 | $7,156 | $622 | $6,534 |
| 2013 | $1,239 | $6,712 | $583 | $6,129 |
Source: Public Records
Map
Nearby Homes