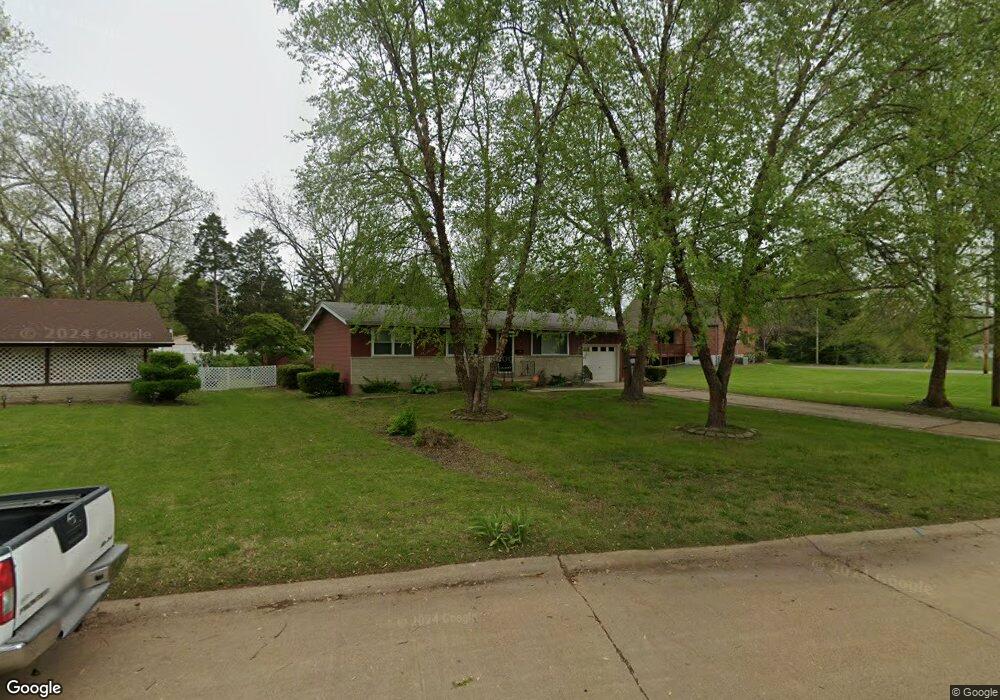
1 Merri Ln Florissant, MO 63031
Estimated Value: $186,385 - $206,000
4
Beds
2
Baths
1,344
Sq Ft
$144/Sq Ft
Est. Value
About This Home
This home is located at 1 Merri Ln, Florissant, MO 63031 and is currently estimated at $193,346, approximately $143 per square foot. 1 Merri Ln is a home located in St. Louis County with nearby schools including McCurdy Elementary School, Northwest Middle School, and Hazelwood West High School.
Ownership History
Date
Name
Owned For
Owner Type
Purchase Details
Closed on
Dec 14, 2012
Sold by
Federal National Mortgage Association
Bought by
Du Yingqiu
Current Estimated Value
Purchase Details
Closed on
Aug 9, 2012
Sold by
Holland Cheryl L and Holland Jack R
Bought by
Federal National Mortgage Association
Purchase Details
Closed on
Jun 25, 2007
Sold by
Grant Sharon K
Bought by
Holland Jack R and Holland Cheryl
Home Financials for this Owner
Home Financials are based on the most recent Mortgage that was taken out on this home.
Original Mortgage
$120,000
Interest Rate
6.19%
Mortgage Type
Purchase Money Mortgage
Create a Home Valuation Report for This Property
The Home Valuation Report is an in-depth analysis detailing your home's value as well as a comparison with similar homes in the area
Home Values in the Area
Average Home Value in this Area
Purchase History
| Date | Buyer | Sale Price | Title Company |
|---|---|---|---|
| Du Yingqiu | $45,000 | Ctc | |
| Federal National Mortgage Association | $121,811 | None Available | |
| Holland Jack R | $120,000 | None Available |
Source: Public Records
Mortgage History
| Date | Status | Borrower | Loan Amount |
|---|---|---|---|
| Previous Owner | Holland Jack R | $120,000 |
Source: Public Records
Tax History Compared to Growth
Tax History
| Year | Tax Paid | Tax Assessment Tax Assessment Total Assessment is a certain percentage of the fair market value that is determined by local assessors to be the total taxable value of land and additions on the property. | Land | Improvement |
|---|---|---|---|---|
| 2025 | $2,817 | $32,990 | $6,710 | $26,280 |
| 2024 | $2,817 | $31,560 | $3,440 | $28,120 |
| 2023 | $2,813 | $31,560 | $3,440 | $28,120 |
| 2022 | $2,356 | $23,510 | $3,840 | $19,670 |
| 2021 | $2,295 | $23,510 | $3,840 | $19,670 |
| 2020 | $2,251 | $21,680 | $3,460 | $18,220 |
| 2019 | $2,217 | $21,680 | $3,460 | $18,220 |
| 2018 | $2,025 | $18,190 | $3,100 | $15,090 |
| 2017 | $2,022 | $18,190 | $3,100 | $15,090 |
| 2016 | $1,675 | $14,820 | $3,100 | $11,720 |
| 2015 | $1,640 | $14,820 | $3,100 | $11,720 |
| 2014 | $1,592 | $14,820 | $3,650 | $11,170 |
Source: Public Records
Map
Nearby Homes
- 130 Ruth Dr
- 8 Mcnulty Dr
- 1105 Patterson Rd
- 25 Hammes Dr
- 1480 Vesper Dr
- 619 Rosetta Dr
- 1540 Angelus Dr
- 6 Charlotte Dr
- 668 Rosetta Dr Unit E6
- 685 Mullanphy Rd
- 890 Tyson Dr
- 710 Thompson Dr
- 1700 Patterson Rd
- 900 Gladiola Dr
- 1155 Mullanphy Rd
- 655 Florland Dr
- 1065 Keeven Ln
- 1365 Saint Jean St
- 1120 Bluebird Dr
- 1415 Boulder Dr