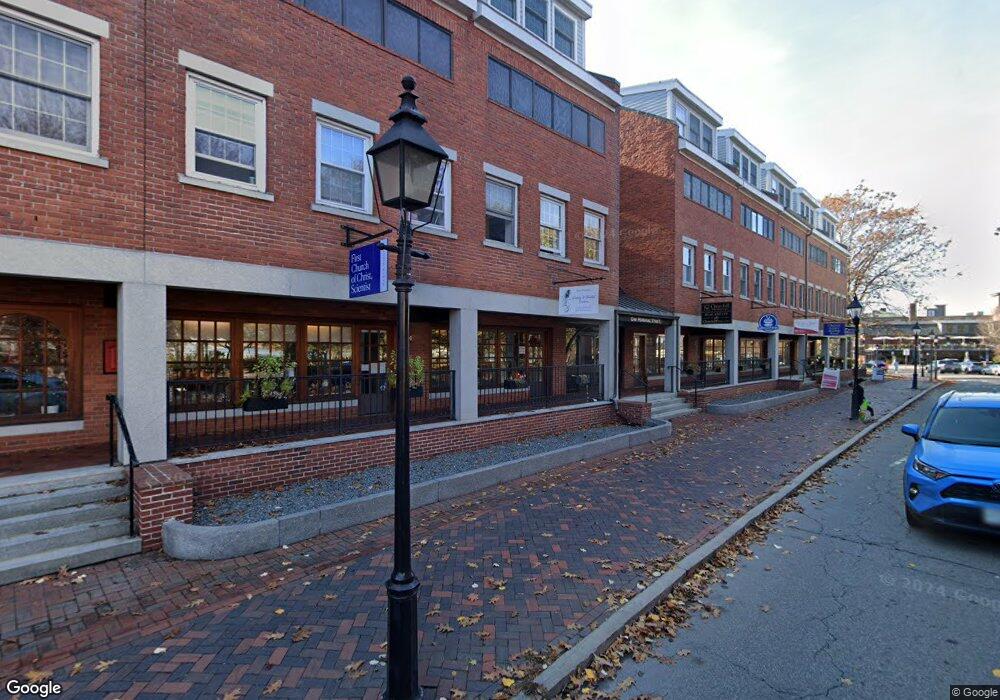
1 Merrimac St Unit 6 Newburyport, MA 01950
Estimated Value: $614,988
--
Bed
1
Bath
834
Sq Ft
$737/Sq Ft
Est. Value
About This Home
This home is located at 1 Merrimac St Unit 6, Newburyport, MA 01950 and is currently estimated at $614,988, approximately $737 per square foot. 1 Merrimac St Unit 6 is a home located in Essex County with nearby schools including Francis T. Bresnahan Elementary School, Edward G. Molin Elementary School, and Rupert A. Nock Middle School.
Ownership History
Date
Name
Owned For
Owner Type
Purchase Details
Closed on
Nov 22, 2019
Sold by
Plum Island Rt
Bought by
Promenade Holdings Llc
Current Estimated Value
Home Financials for this Owner
Home Financials are based on the most recent Mortgage that was taken out on this home.
Original Mortgage
$680,000
Outstanding Balance
$597,026
Interest Rate
3.5%
Mortgage Type
New Conventional
Estimated Equity
$17,962
Purchase Details
Closed on
Dec 12, 2018
Sold by
Downtown Newburyport Rlty
Bought by
Plum Rt
Home Financials for this Owner
Home Financials are based on the most recent Mortgage that was taken out on this home.
Original Mortgage
$550,000
Interest Rate
4.8%
Mortgage Type
New Conventional
Purchase Details
Closed on
Oct 12, 2017
Sold by
Portshop Llc
Bought by
Downtown Newburyport R
Purchase Details
Closed on
Dec 29, 2011
Sold by
Aurora Rt
Bought by
Portshop Llc
Create a Home Valuation Report for This Property
The Home Valuation Report is an in-depth analysis detailing your home's value as well as a comparison with similar homes in the area
Home Values in the Area
Average Home Value in this Area
Purchase History
| Date | Buyer | Sale Price | Title Company |
|---|---|---|---|
| Promenade Holdings Llc | $850,000 | -- | |
| Plum Rt | $385,000 | -- | |
| Downtown Newburyport R | $352,000 | -- | |
| Portshop Llc | $275,000 | -- |
Source: Public Records
Mortgage History
| Date | Status | Borrower | Loan Amount |
|---|---|---|---|
| Open | Promenade Holdings Llc | $680,000 | |
| Previous Owner | Plum Rt | $550,000 | |
| Previous Owner | Portshop Llc | $175,000 |
Source: Public Records
Tax History Compared to Growth
Tax History
| Year | Tax Paid | Tax Assessment Tax Assessment Total Assessment is a certain percentage of the fair market value that is determined by local assessors to be the total taxable value of land and additions on the property. | Land | Improvement |
|---|---|---|---|---|
| 2025 | $4,505 | $470,300 | $0 | $470,300 |
| 2024 | $4,313 | $432,600 | $0 | $432,600 |
| 2023 | $3,871 | $360,400 | $0 | $360,400 |
| 2022 | $4,521 | $376,400 | $0 | $376,400 |
| 2021 | $4,534 | $358,700 | $0 | $358,700 |
| 2020 | $4,606 | $358,700 | $0 | $358,700 |
| 2019 | $4,019 | $307,300 | $0 | $307,300 |
| 2018 | $3,018 | $227,600 | $0 | $227,600 |
| 2017 | $3,061 | $227,600 | $0 | $227,600 |
| 2016 | $3,023 | $225,800 | $0 | $225,800 |
| 2015 | $3,522 | $264,000 | $0 | $264,000 |
Source: Public Records
Map
Nearby Homes
- 10 10th St
- 58 Merrimac St Unit 2-5
- 30-32 Water St Unit 4
- 11 Charter St
- 2 Court St Unit 4
- 105 State St Unit 301
- 105 State St Unit 101
- 105 State St Unit 201
- 42 Federal St Unit B
- 95 High St Unit 4
- 95 High St Unit 1
- 126 Merrimac St Unit 47
- 126 Merrimac St Unit 35
- 41 Washington St Unit B
- 158 Merrimac St Unit 3
- 45 Boardman St Unit 1
- 175 Bridge Rd
- 1 Hill St
- 1 Hill St Unit 1
- 58 Lime St Unit 5
- 1 Merrimac St Unit 8
- 1 Merrimac St Unit 15
- 1 Merrimac St Unit 14
- 1 Merrimac St Unit 12
- 1 Merrimac St Unit 20
- 1 Merrimac St Unit 3
- 1 Merrimac St Unit 7
- 1 Merrimac St Unit 4
- 1 Merrimac St Unit 30
- 1 Merrimac St Unit 29
- 1 Merrimac St Unit 28
- 1 Merrimac St Unit 27
- 1 Merrimac St Unit 25
- 1 Merrimac St Unit 24
- 1 Merrimac St Unit 23
- 1 Merrimac St Unit 22
- 1 Merrimac St Unit 21
- 1 Merrimac St
- 36 Market Square
- 2 Unicorn St