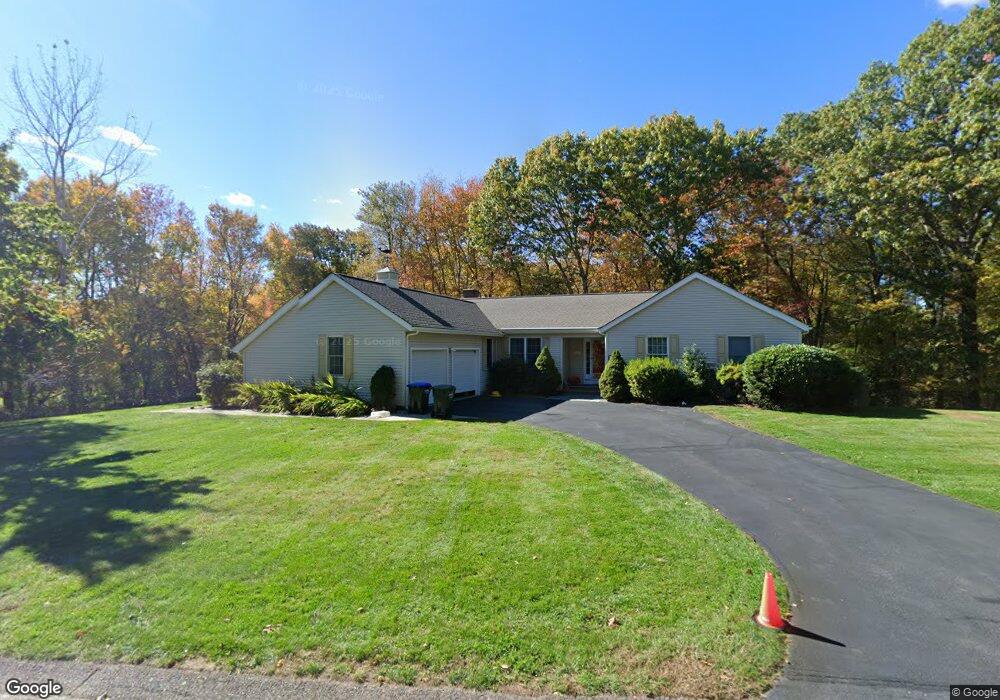
1 Mikayla Ann Dr Rehoboth, MA 02769
Estimated Value: $747,363 - $881,000
3
Beds
2
Baths
2,403
Sq Ft
$336/Sq Ft
Est. Value
About This Home
This home is located at 1 Mikayla Ann Dr, Rehoboth, MA 02769 and is currently estimated at $807,591, approximately $336 per square foot. 1 Mikayla Ann Dr is a home located in Bristol County with nearby schools including Dighton-Rehoboth Regional High School and Cedar Brook School.
Ownership History
Date
Name
Owned For
Owner Type
Purchase Details
Closed on
Feb 3, 2005
Sold by
Cahill James P and Cahill Judith L
Bought by
Cahill James P and Cahill Judith L
Current Estimated Value
Purchase Details
Closed on
Jan 3, 2001
Sold by
Duvally Dev Rt and Duvally John P
Bought by
Cahill James P and Cahill Judith L
Home Financials for this Owner
Home Financials are based on the most recent Mortgage that was taken out on this home.
Original Mortgage
$252,000
Interest Rate
7.69%
Mortgage Type
Purchase Money Mortgage
Create a Home Valuation Report for This Property
The Home Valuation Report is an in-depth analysis detailing your home's value as well as a comparison with similar homes in the area
Home Values in the Area
Average Home Value in this Area
Purchase History
| Date | Buyer | Sale Price | Title Company |
|---|---|---|---|
| Cahill James P | -- | -- | |
| Cahill James P | $90,000 | -- |
Source: Public Records
Mortgage History
| Date | Status | Borrower | Loan Amount |
|---|---|---|---|
| Previous Owner | Cahill James P | $252,000 |
Source: Public Records
Tax History Compared to Growth
Tax History
| Year | Tax Paid | Tax Assessment Tax Assessment Total Assessment is a certain percentage of the fair market value that is determined by local assessors to be the total taxable value of land and additions on the property. | Land | Improvement |
|---|---|---|---|---|
| 2025 | $74 | $660,500 | $203,100 | $457,400 |
| 2024 | $7,260 | $639,100 | $211,800 | $427,300 |
| 2023 | $7,092 | $612,400 | $207,400 | $405,000 |
| 2022 | $6,686 | $527,700 | $190,500 | $337,200 |
| 2021 | $6,318 | $477,200 | $173,900 | $303,300 |
| 2020 | $5,992 | $456,700 | $177,100 | $279,600 |
| 2018 | $5,415 | $452,400 | $173,400 | $279,000 |
| 2017 | $0 | $397,600 | $181,000 | $216,600 |
| 2016 | $5,008 | $412,200 | $188,700 | $223,500 |
| 2015 | $4,675 | $379,800 | $180,100 | $199,700 |
| 2014 | $4,616 | $371,100 | $171,400 | $199,700 |
Source: Public Records
Map
Nearby Homes