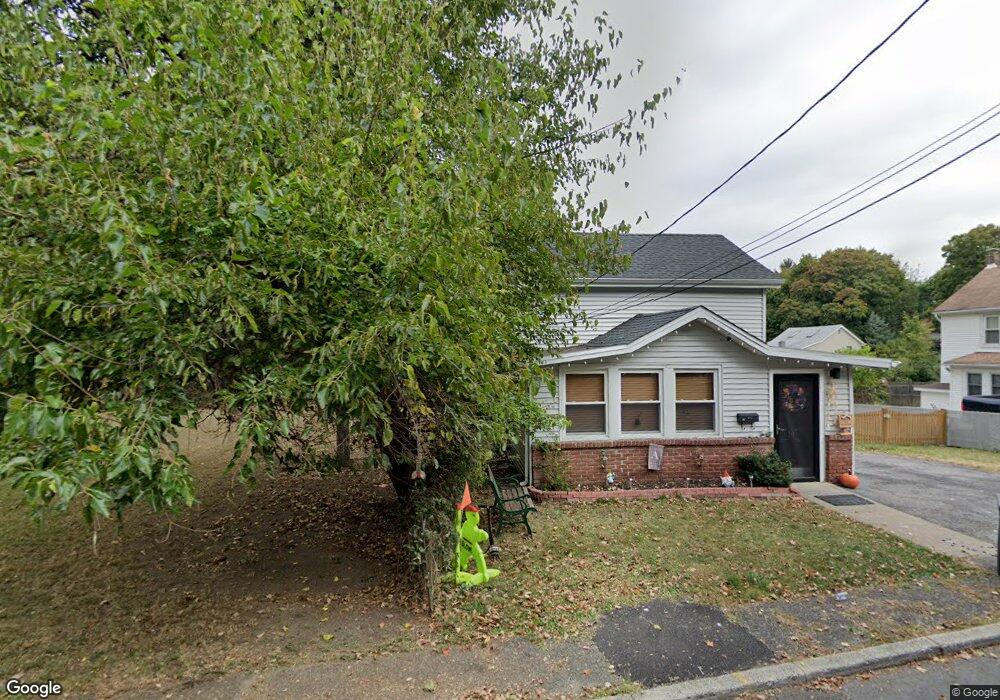
1 Military Ln Cornwall On Hudson, NY 12520
Estimated Value: $548,000 - $706,029
2
Beds
3
Baths
3,208
Sq Ft
$195/Sq Ft
Est. Value
About This Home
This home is located at 1 Military Ln, Cornwall On Hudson, NY 12520 and is currently estimated at $624,257, approximately $194 per square foot. 1 Military Ln is a home with nearby schools including Cornwall Middle School, Little Harvard, and San Miguel Academy Of Newburgh.
Ownership History
Date
Name
Owned For
Owner Type
Purchase Details
Closed on
Jun 4, 2014
Sold by
Nyma Holding Inc
Bought by
Lattimore Andrew
Current Estimated Value
Home Financials for this Owner
Home Financials are based on the most recent Mortgage that was taken out on this home.
Original Mortgage
$193,150
Interest Rate
4.12%
Mortgage Type
New Conventional
Purchase Details
Closed on
Feb 28, 2013
Sold by
New York Military Academy Holding Inc
Bought by
Yannone Raymond
Create a Home Valuation Report for This Property
The Home Valuation Report is an in-depth analysis detailing your home's value as well as a comparison with similar homes in the area
Home Values in the Area
Average Home Value in this Area
Purchase History
| Date | Buyer | Sale Price | Title Company |
|---|---|---|---|
| Lattimore Andrew | $210,000 | Jeffrey Russell Werner | |
| Yannone Raymond | -- | Joseph Saffioti |
Source: Public Records
Mortgage History
| Date | Status | Borrower | Loan Amount |
|---|---|---|---|
| Closed | Lattimore Andrew | $193,150 |
Source: Public Records
Tax History Compared to Growth
Tax History
| Year | Tax Paid | Tax Assessment Tax Assessment Total Assessment is a certain percentage of the fair market value that is determined by local assessors to be the total taxable value of land and additions on the property. | Land | Improvement |
|---|---|---|---|---|
| 2024 | $15,039 | $368,900 | $90,300 | $278,600 |
| 2023 | $15,039 | $368,900 | $90,300 | $278,600 |
| 2022 | $14,733 | $368,900 | $90,300 | $278,600 |
| 2021 | $13,981 | $368,900 | $90,300 | $278,600 |
| 2020 | $14,420 | $368,900 | $90,300 | $278,600 |
| 2019 | $14,086 | $368,900 | $90,300 | $278,600 |
| 2018 | $14,086 | $368,900 | $90,300 | $278,600 |
| 2017 | $13,934 | $368,900 | $90,300 | $278,600 |
| 2016 | $12,134 | $243,850 | $56,800 | $187,050 |
| 2015 | -- | $243,850 | $56,800 | $187,050 |
| 2014 | -- | $185,100 | $56,800 | $128,300 |
Source: Public Records
Map
Nearby Homes