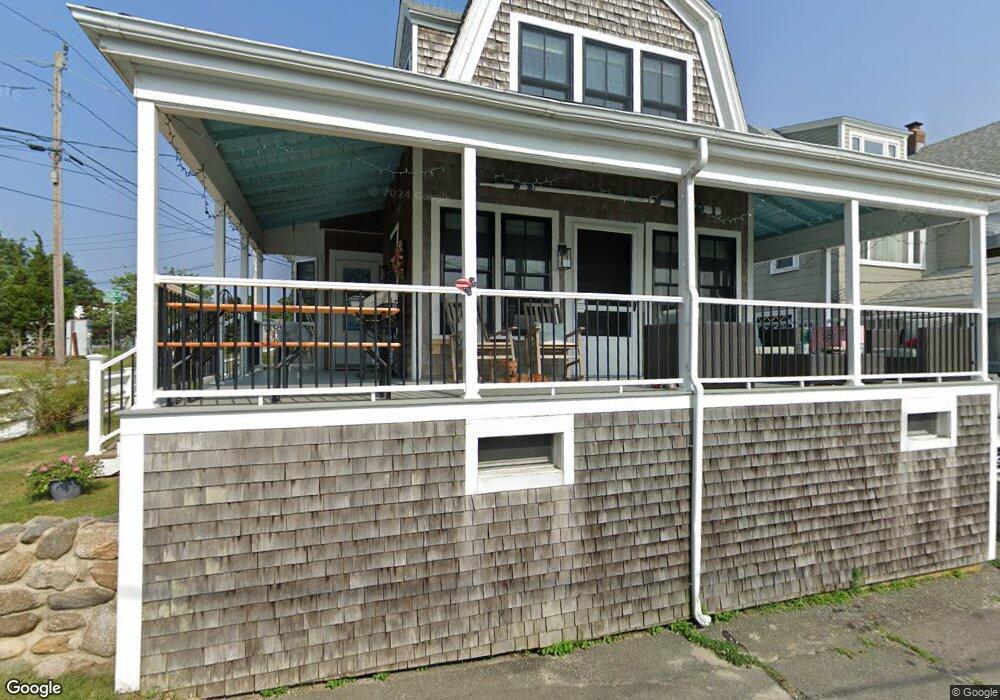
1 Monument Ave Bourne, MA 2532
Monument Beach NeighborhoodEstimated Value: $747,000 - $802,000
4
Beds
2
Baths
1,624
Sq Ft
$474/Sq Ft
Est. Value
About This Home
This home is located at 1 Monument Ave, Bourne, MA 2532 and is currently estimated at $770,258, approximately $474 per square foot. 1 Monument Ave is a home located in Barnstable County with nearby schools including Bourne High School, St Margaret Regional School, and Cadence Academy Preschool - Bourne.
Ownership History
Date
Name
Owned For
Owner Type
Purchase Details
Closed on
Nov 18, 2022
Sold by
Worcester Avenue Rt and Tenaglia
Bought by
Manson Robert L and Manson Mary J
Current Estimated Value
Home Financials for this Owner
Home Financials are based on the most recent Mortgage that was taken out on this home.
Original Mortgage
$285,000
Outstanding Balance
$275,569
Interest Rate
6.94%
Mortgage Type
Purchase Money Mortgage
Estimated Equity
$494,689
Create a Home Valuation Report for This Property
The Home Valuation Report is an in-depth analysis detailing your home's value as well as a comparison with similar homes in the area
Home Values in the Area
Average Home Value in this Area
Purchase History
| Date | Buyer | Sale Price | Title Company |
|---|---|---|---|
| Manson Robert L | $675,000 | None Available | |
| Manson Robert L | $675,000 | None Available |
Source: Public Records
Mortgage History
| Date | Status | Borrower | Loan Amount |
|---|---|---|---|
| Open | Manson Robert L | $285,000 | |
| Closed | Manson Robert L | $285,000 |
Source: Public Records
Tax History
| Year | Tax Paid | Tax Assessment Tax Assessment Total Assessment is a certain percentage of the fair market value that is determined by local assessors to be the total taxable value of land and additions on the property. | Land | Improvement |
|---|---|---|---|---|
| 2025 | $5,148 | $659,200 | $323,900 | $335,300 |
| 2024 | $5,069 | $632,000 | $308,400 | $323,600 |
| 2023 | $5,175 | $587,400 | $301,000 | $286,400 |
| 2022 | $4,709 | $466,700 | $266,400 | $200,300 |
| 2021 | $4,575 | $424,800 | $242,400 | $182,400 |
| 2020 | $4,541 | $422,800 | $240,100 | $182,700 |
| 2019 | $4,335 | $412,500 | $240,100 | $172,400 |
| 2018 | $4,141 | $392,900 | $228,700 | $164,200 |
| 2017 | $4,008 | $389,100 | $226,500 | $162,600 |
| 2016 | $3,668 | $361,000 | $226,500 | $134,500 |
| 2015 | $3,635 | $361,000 | $226,500 | $134,500 |
Source: Public Records
Map
Nearby Homes
- 566 Shore Rd
- 10 Howard Ave
- 10 Howard Ave
- 203 County Rd
- 14 Navajo Rd
- 35 Benedict Rd
- 16 Amberwood Ct
- 20 Colony Ave
- 5 Harbor Hill Dr
- 4 Harbor Hill Dr
- 12 Turnberry Rd Unit 12
- 13 Laurel Hill Ct
- 2 Applewood Ct
- 5 Sea Knoll Ct
- 5 Zoli Ln
- 709 County Rd
- 4 Hollyhock Knoll Ct Unit 4
- 4 Hollyhock Knoll Ct Unit 4
- 254 Barlows Landing Rd
- 3 1st St
Your Personal Tour Guide
Ask me questions while you tour the home.