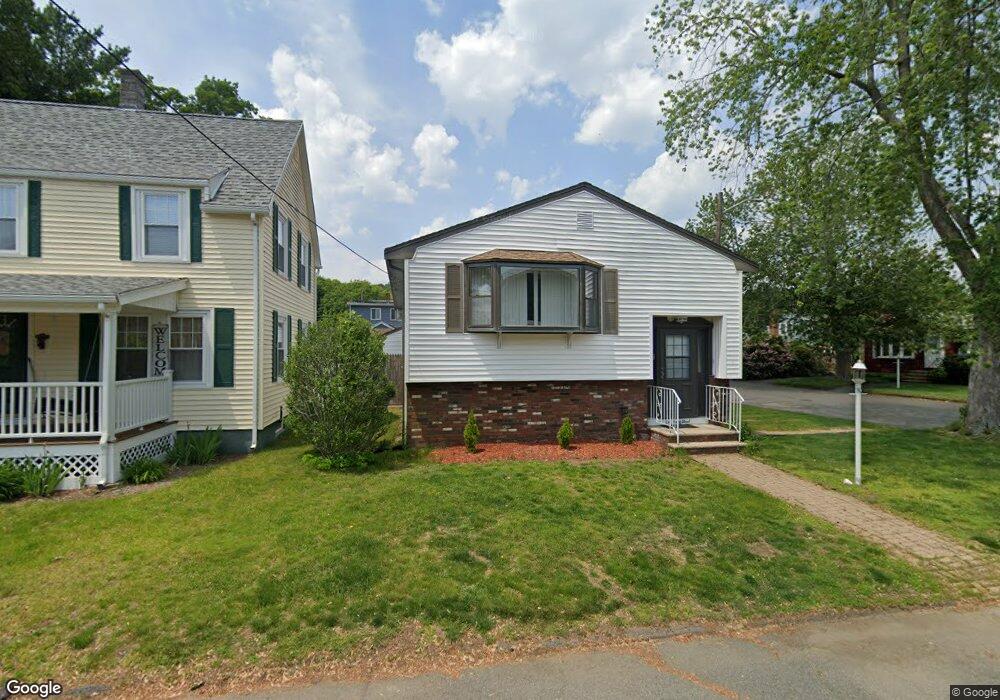
1 Moray St Unit 1 Lynn, MA 01904
Indian Ridge NeighborhoodEstimated Value: $502,000 - $631,000
2
Beds
3
Baths
2,000
Sq Ft
$284/Sq Ft
Est. Value
About This Home
This home is located at 1 Moray St Unit 1, Lynn, MA 01904 and is currently estimated at $567,789, approximately $283 per square foot. 1 Moray St Unit 1 is a home located in Essex County with nearby schools including Capt. William G. Shoemaker Elementary School, William R. Fallon School, and Pickering Middle School.
Ownership History
Date
Name
Owned For
Owner Type
Purchase Details
Closed on
Mar 16, 2018
Sold by
Gmk Nt
Bought by
Doherty Kevin W
Current Estimated Value
Home Financials for this Owner
Home Financials are based on the most recent Mortgage that was taken out on this home.
Original Mortgage
$322,050
Outstanding Balance
$274,917
Interest Rate
4.22%
Mortgage Type
New Conventional
Estimated Equity
$292,872
Purchase Details
Closed on
Apr 21, 2017
Sold by
Saunders Shirley J Est
Bought by
Gmk Nt
Purchase Details
Closed on
Jan 1, 1974
Bought by
Saunders Shirley J
Create a Home Valuation Report for This Property
The Home Valuation Report is an in-depth analysis detailing your home's value as well as a comparison with similar homes in the area
Home Values in the Area
Average Home Value in this Area
Purchase History
| Date | Buyer | Sale Price | Title Company |
|---|---|---|---|
| Doherty Kevin W | $339,000 | -- | |
| Gmk Nt | $225,000 | -- | |
| Saunders Shirley J | -- | -- |
Source: Public Records
Mortgage History
| Date | Status | Borrower | Loan Amount |
|---|---|---|---|
| Open | Doherty Kevin W | $322,050 | |
| Previous Owner | Saunders Shirley J | $15,000 |
Source: Public Records
Tax History Compared to Growth
Tax History
| Year | Tax Paid | Tax Assessment Tax Assessment Total Assessment is a certain percentage of the fair market value that is determined by local assessors to be the total taxable value of land and additions on the property. | Land | Improvement |
|---|---|---|---|---|
| 2025 | $4,480 | $432,400 | $194,200 | $238,200 |
| 2024 | $4,640 | $440,600 | $193,000 | $247,600 |
| 2023 | $4,588 | $411,500 | $193,000 | $218,500 |
| 2022 | $4,649 | $374,000 | $170,000 | $204,000 |
| 2021 | $4,305 | $330,400 | $145,400 | $185,000 |
| 2020 | $4,182 | $312,100 | $138,600 | $173,500 |
| 2019 | $4,220 | $295,100 | $130,900 | $164,200 |
| 2018 | $4,116 | $271,700 | $131,800 | $139,900 |
| 2017 | $3,962 | $254,000 | $123,700 | $130,300 |
| 2016 | $4,380 | $270,700 | $109,700 | $161,000 |
| 2015 | $3,911 | $233,500 | $102,900 | $130,600 |
Source: Public Records
Map
Nearby Homes