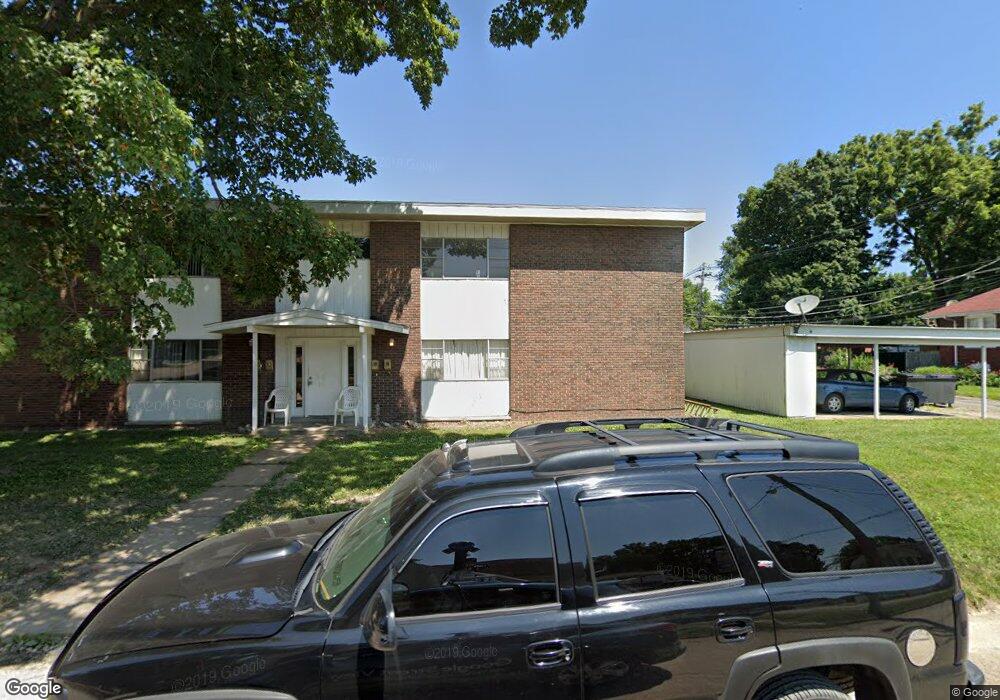
1 N 40th St Belleville, IL 62226
Estimated Value: $187,000 - $230,000
Studio
--
Bath
1,690
Sq Ft
$124/Sq Ft
Est. Value
About This Home
This home is located at 1 N 40th St, Belleville, IL 62226 and is currently estimated at $209,740, approximately $124 per square foot. 1 N 40th St is a home located in St. Clair County with nearby schools including Union Elementary School, West Jr High School, and Our Lady Queen Of Peace Catholic School.
Ownership History
Date
Name
Owned For
Owner Type
Purchase Details
Closed on
Apr 10, 2015
Sold by
Kolb Charles T and Kolb John O
Bought by
Jc Auto Rentals
Current Estimated Value
Purchase Details
Closed on
Feb 26, 2008
Sold by
Richter Ronald L and Richter Denise E
Bought by
Kolb Charles T and Kolb John O
Home Financials for this Owner
Home Financials are based on the most recent Mortgage that was taken out on this home.
Original Mortgage
$135,000
Interest Rate
6.25%
Mortgage Type
Commercial
Create a Home Valuation Report for This Property
The Home Valuation Report is an in-depth analysis detailing your home's value as well as a comparison with similar homes in the area
Home Values in the Area
Average Home Value in this Area
Purchase History
| Date | Buyer | Sale Price | Title Company |
|---|---|---|---|
| Jc Auto Rentals | -- | None Available | |
| Kolb Charles T | $142,500 | Community Title Shiloh Llc |
Source: Public Records
Mortgage History
| Date | Status | Borrower | Loan Amount |
|---|---|---|---|
| Previous Owner | Kolb Charles T | $135,000 |
Source: Public Records
Tax History
| Year | Tax Paid | Tax Assessment Tax Assessment Total Assessment is a certain percentage of the fair market value that is determined by local assessors to be the total taxable value of land and additions on the property. | Land | Improvement |
|---|---|---|---|---|
| 2024 | $5,102 | $58,024 | $9,653 | $48,371 |
| 2023 | $5,339 | $56,875 | $9,462 | $47,413 |
| 2022 | $4,901 | $51,202 | $8,518 | $42,684 |
| 2021 | $4,720 | $47,335 | $7,875 | $39,460 |
| 2020 | $4,587 | $44,763 | $7,447 | $37,316 |
| 2019 | $4,222 | $40,754 | $7,458 | $33,296 |
| 2018 | $4,128 | $39,873 | $7,297 | $32,576 |
| 2017 | $4,096 | $39,593 | $7,246 | $32,347 |
| 2016 | $4,045 | $38,752 | $7,092 | $31,660 |
| 2014 | $3,744 | $40,495 | $7,088 | $33,407 |
| 2013 | $3,705 | $41,074 | $7,189 | $33,885 |
Source: Public Records
Map
Nearby Homes
Your Personal Tour Guide
Ask me questions while you tour the home.