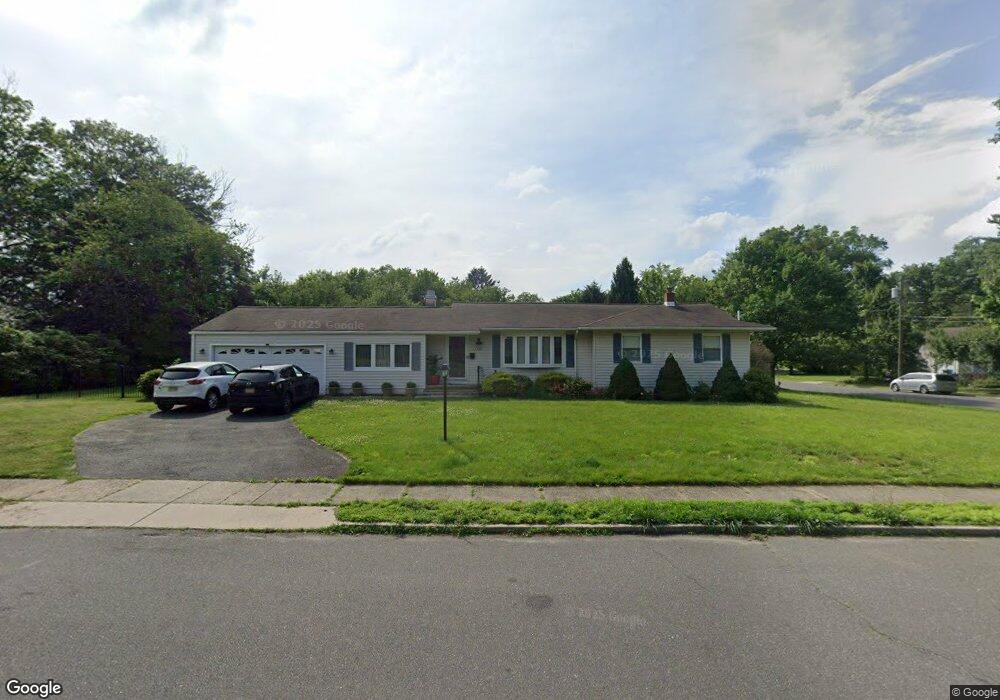
1 Obrien Rd Cranbury, NJ 08512
Estimated Value: $695,383 - $791,000
--
Bed
--
Bath
1,772
Sq Ft
$429/Sq Ft
Est. Value
About This Home
This home is located at 1 Obrien Rd, Cranbury, NJ 08512 and is currently estimated at $759,346, approximately $428 per square foot. 1 Obrien Rd is a home located in Middlesex County with nearby schools including The Cranbury School, E Windsor Knowledge Beginnings, and SciCore Academy.
Ownership History
Date
Name
Owned For
Owner Type
Purchase Details
Closed on
Feb 24, 2021
Sold by
Stewart Michael and Estate Of June Stewart
Bought by
Keyes Robert Edward and Keyes Emily Laura
Current Estimated Value
Home Financials for this Owner
Home Financials are based on the most recent Mortgage that was taken out on this home.
Original Mortgage
$481,124
Outstanding Balance
$432,741
Interest Rate
2.9%
Mortgage Type
FHA
Estimated Equity
$326,605
Create a Home Valuation Report for This Property
The Home Valuation Report is an in-depth analysis detailing your home's value as well as a comparison with similar homes in the area
Home Values in the Area
Average Home Value in this Area
Purchase History
| Date | Buyer | Sale Price | Title Company |
|---|---|---|---|
| Keyes Robert Edward | $490,000 | Two Rivers Title Co Llc |
Source: Public Records
Mortgage History
| Date | Status | Borrower | Loan Amount |
|---|---|---|---|
| Open | Keyes Robert Edward | $481,124 |
Source: Public Records
Tax History Compared to Growth
Tax History
| Year | Tax Paid | Tax Assessment Tax Assessment Total Assessment is a certain percentage of the fair market value that is determined by local assessors to be the total taxable value of land and additions on the property. | Land | Improvement |
|---|---|---|---|---|
| 2025 | $8,954 | $488,200 | $237,900 | $250,300 |
| 2024 | $8,827 | $488,200 | $237,900 | $250,300 |
| 2023 | $8,827 | $488,200 | $237,900 | $250,300 |
| 2022 | $8,700 | $488,200 | $237,900 | $250,300 |
| 2021 | $6,536 | $488,200 | $237,900 | $250,300 |
| 2020 | $8,690 | $488,200 | $237,900 | $250,300 |
| 2019 | $8,783 | $488,200 | $237,900 | $250,300 |
| 2018 | $9,613 | $488,200 | $237,900 | $250,300 |
| 2017 | $9,359 | $488,200 | $237,900 | $250,300 |
| 2016 | $9,437 | $488,200 | $237,900 | $250,300 |
| 2015 | $9,266 | $488,200 | $237,900 | $250,300 |
| 2014 | $9,300 | $488,200 | $237,900 | $250,300 |
Source: Public Records
Map
Nearby Homes