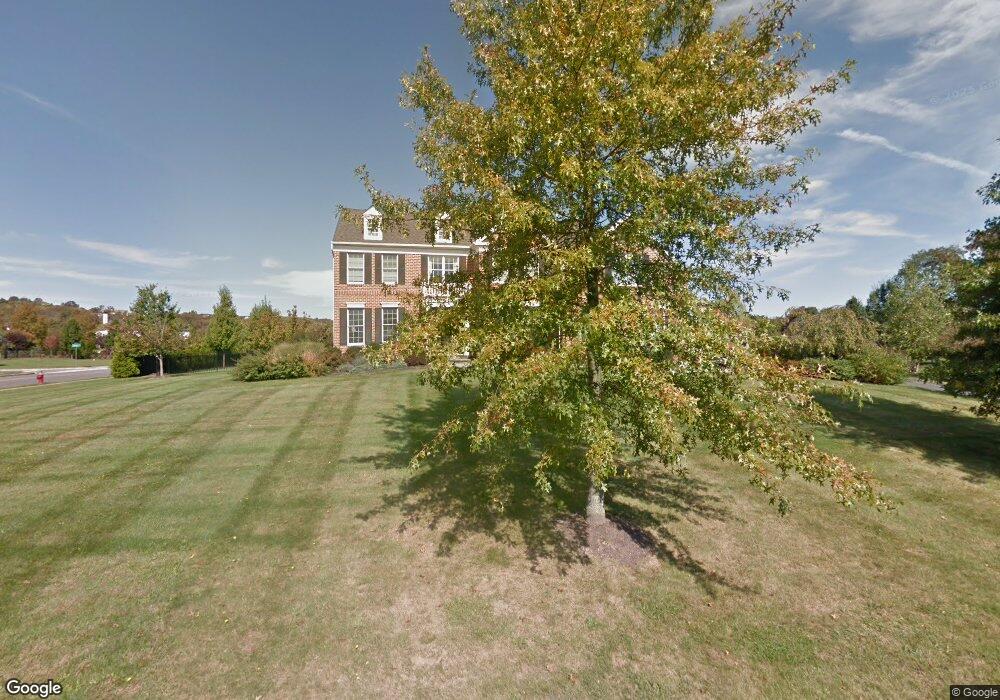
1 Old Field Ct Flemington, NJ 08822
Estimated Value: $958,256 - $1,054,000
--
Bed
--
Bath
3,524
Sq Ft
$285/Sq Ft
Est. Value
About This Home
This home is located at 1 Old Field Ct, Flemington, NJ 08822 and is currently estimated at $1,005,814, approximately $285 per square foot. 1 Old Field Ct is a home located in Hunterdon County with nearby schools including Copper Hill School, Reading Fleming Intermediate School, and J.P. Case Middle School.
Ownership History
Date
Name
Owned For
Owner Type
Purchase Details
Closed on
Feb 28, 2003
Sold by
Toll Nj Iv Lp
Bought by
Cleary Scott P and Cleary Tanya
Current Estimated Value
Home Financials for this Owner
Home Financials are based on the most recent Mortgage that was taken out on this home.
Original Mortgage
$320,000
Outstanding Balance
$138,571
Interest Rate
5.98%
Estimated Equity
$867,243
Create a Home Valuation Report for This Property
The Home Valuation Report is an in-depth analysis detailing your home's value as well as a comparison with similar homes in the area
Home Values in the Area
Average Home Value in this Area
Purchase History
| Date | Buyer | Sale Price | Title Company |
|---|---|---|---|
| Cleary Scott P | $575,618 | -- |
Source: Public Records
Mortgage History
| Date | Status | Borrower | Loan Amount |
|---|---|---|---|
| Open | Cleary Scott P | $320,000 |
Source: Public Records
Tax History Compared to Growth
Tax History
| Year | Tax Paid | Tax Assessment Tax Assessment Total Assessment is a certain percentage of the fair market value that is determined by local assessors to be the total taxable value of land and additions on the property. | Land | Improvement |
|---|---|---|---|---|
| 2025 | $19,164 | $661,500 | $243,700 | $417,800 |
| 2024 | $18,019 | $661,500 | $243,700 | $417,800 |
| 2023 | $18,019 | $661,500 | $243,700 | $417,800 |
| 2022 | $17,563 | $661,500 | $243,700 | $417,800 |
| 2021 | $16,663 | $661,500 | $243,700 | $417,800 |
| 2020 | $17,007 | $661,500 | $243,700 | $417,800 |
| 2019 | $16,663 | $661,500 | $243,700 | $417,800 |
| 2018 | $16,379 | $658,300 | $243,700 | $414,600 |
| 2017 | $15,401 | $628,600 | $243,700 | $384,900 |
| 2016 | $15,124 | $628,600 | $243,700 | $384,900 |
| 2015 | $14,741 | $628,600 | $243,700 | $384,900 |
| 2014 | $14,546 | $628,600 | $243,700 | $384,900 |
Source: Public Records
Map
Nearby Homes
- 33 Sergeantsville Rd
- 15 Colts Ln
- 100 State Route 12
- 41 Bonetown Rd
- 110 Mine St
- 5 Erin Place
- 16 Stillwater Ln
- 402 Clark Cir
- 17 Village Glen Rd
- 5 William Martin Way Unit 5
- 0 Hardscrabble Hill Rd
- 84 Saxonney Cir
- 12 Corcoran St
- 181 Old Croton Rd
- 81 Elwood Ave
- 803 Yorkshire Dr
- 603 Nottingham Way
- 92 Park Ave
- 17 Londonderry Dr
- 526 County Road 579